. 2015 Sep 22;112(38):E5271-80.
doi: 10.1073/pnas.1506576112. Epub 2015 Sep 8.

Caenorhabditis elegans ALG-1 antimorphic mutations uncover functions for Argonaute in microRNA guide strand selection and passenger strand disposal

Affiliations

Caenorhabditis elegans ALG-1 antimorphic mutations uncover functions for Argonaute in microRNA guide strand selection and passenger strand disposal

Anna Y Zinovyeva et al. Proc Natl Acad Sci U S A. .

Abstract

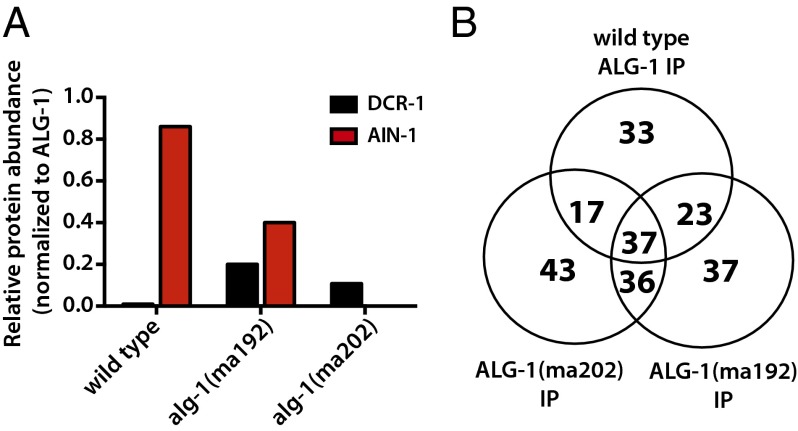
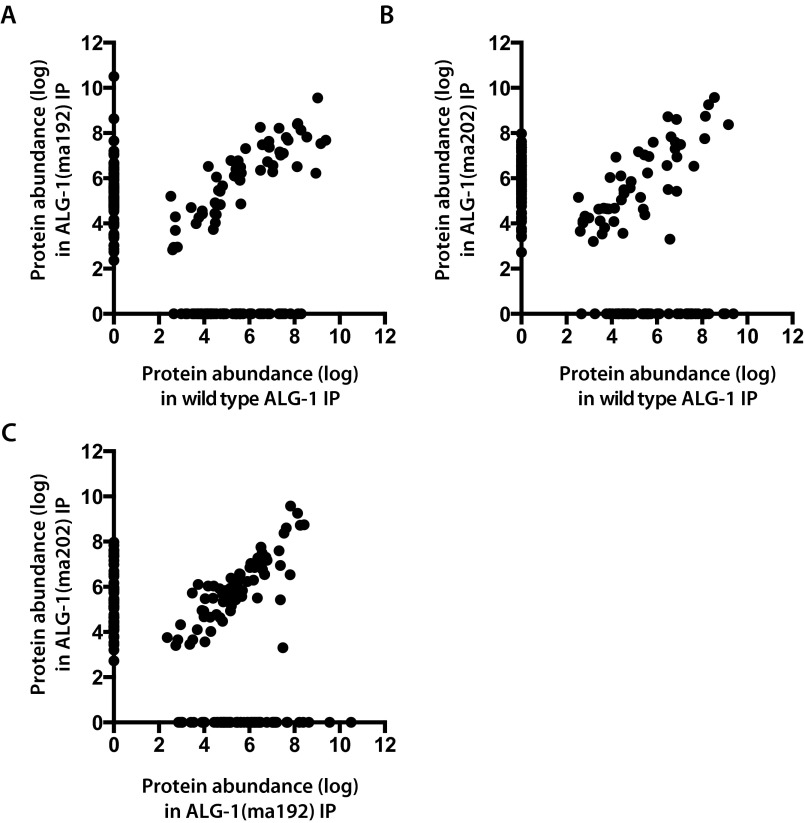
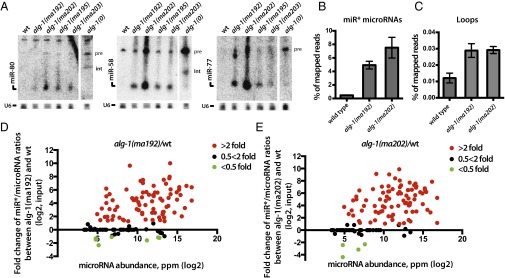
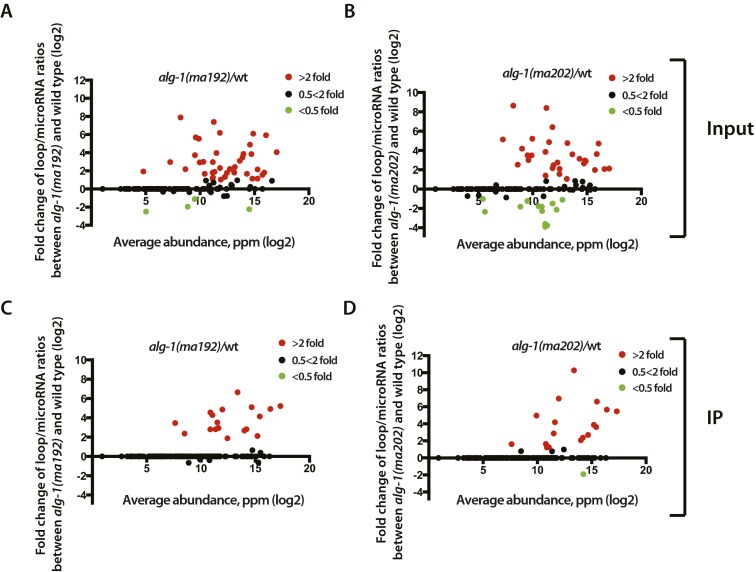
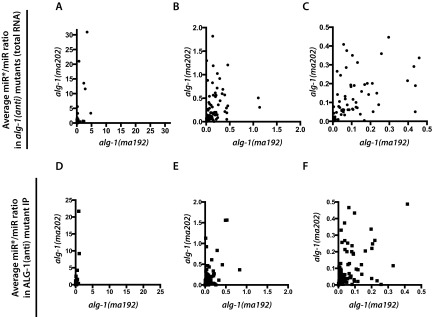
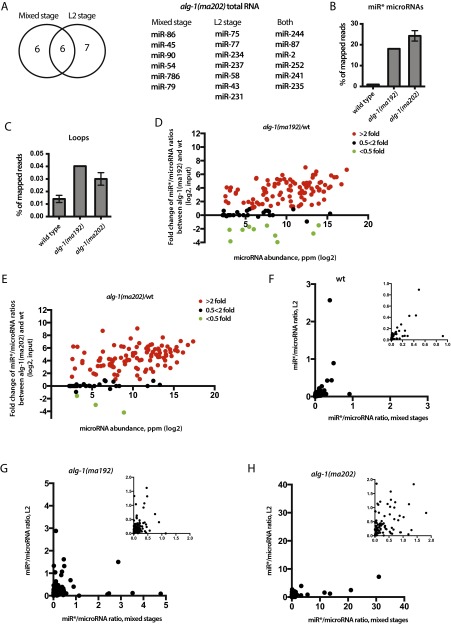
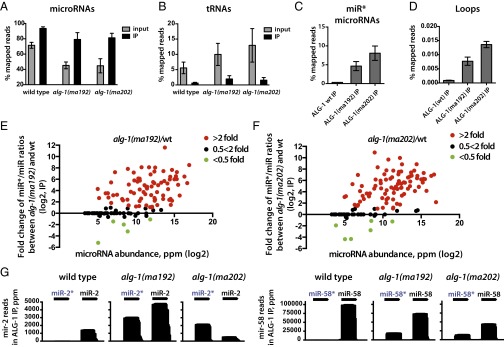
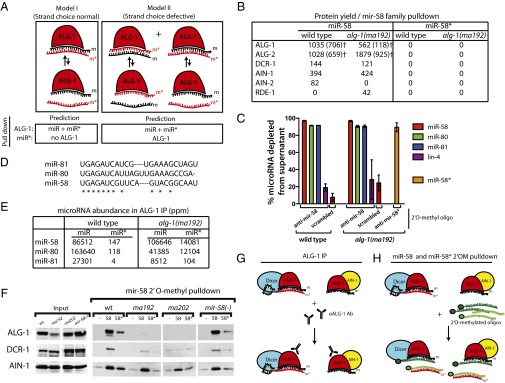
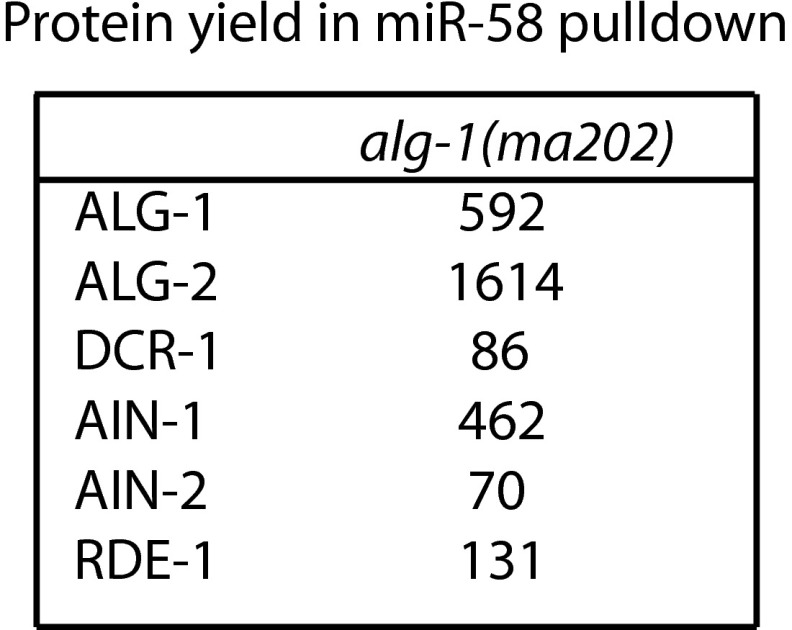
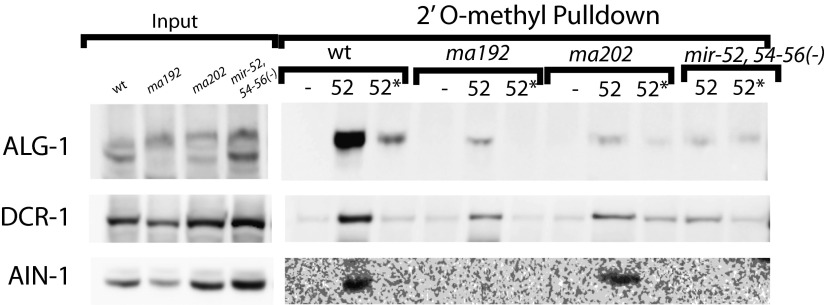
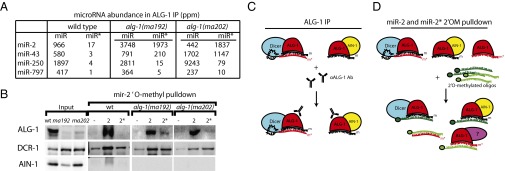
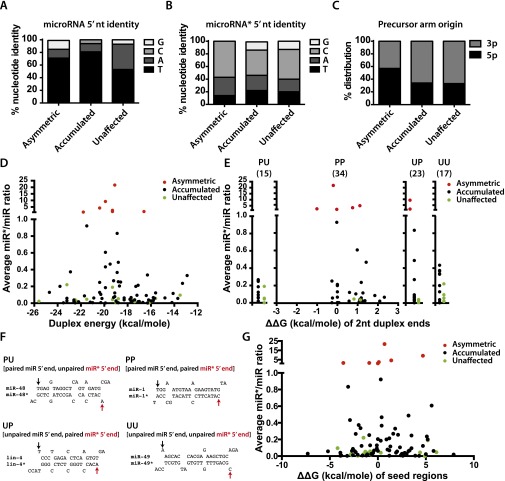
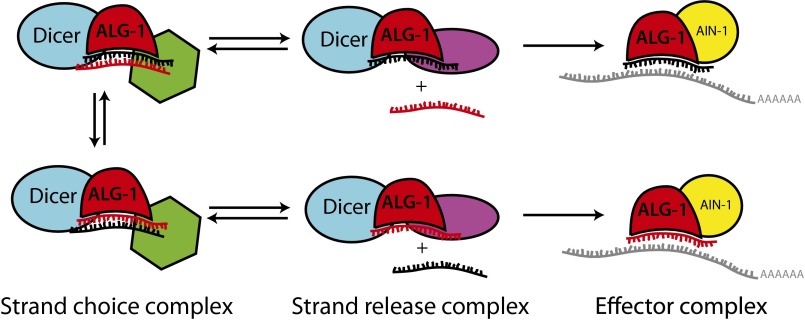
MicroRNAs are regulators of gene expression whose functions are critical for normal development and physiology. We have previously characterized mutations in a Caenorhabditis elegans microRNA-specific Argonaute ALG-1 (Argonaute-like gene) that are antimorphic [alg-1(anti)]. alg-1(anti) mutants have dramatically stronger microRNA-related phenotypes than animals with a complete loss of ALG-1. ALG-1(anti) miRISC (microRNA induced silencing complex) fails to undergo a functional transition from microRNA processing to target repression. To better understand this transition, we characterized the small RNA and protein populations associated with ALG-1(anti) complexes in vivo. We extensively characterized proteins associated with wild-type and mutant ALG-1 and found that the mutant ALG-1(anti) protein fails to interact with numerous miRISC cofactors, including proteins known to be necessary for target repression. In addition, alg-1(anti) mutants dramatically overaccumulated microRNA* (passenger) strands, and immunoprecipitated ALG-1(anti) complexes contained nonstoichiometric yields of mature microRNA and microRNA* strands, with some microRNA* strands present in the ALG-1(anti) Argonaute far in excess of the corresponding mature microRNAs. We show complex and microRNA-specific defects in microRNA strand selection and microRNA* strand disposal. For certain microRNAs (for example mir-58), microRNA guide strand selection by ALG-1(anti) appeared normal, but microRNA* strand release was inefficient. For other microRNAs (such as mir-2), both the microRNA and microRNA* strands were selected as guide by ALG-1(anti), indicating a defect in normal specificity of the strand choice. Our results suggest that wild-type ALG-1 complexes recognize structural features of particular microRNAs in the context of conducting the strand selection and microRNA* ejection steps of miRISC maturation.

Keywords: ALG-1; Argonaute; microRNA; microRNA*; passenger.


Conflict of interest statement

The authors declare no conflict of interest.

Figures

Fig. 1.
Fig. 1.
Wild-type ALG-1 and ALG-1(anti) associate with distinct but overlapping protein populations. ALG-1 was immunoprecipitated from extracts of wild-type or alg-1(anti) animals using anti–ALG-1 antisera, and proteins were quantified by MudPIT proteomics, as described in SI Materials and Methods. (A) Association of AIN-1 with ALG-1(ma192) and ALG-1(ma202) is reduced compared with wild-type ALG-1, whereas association of DCR-1 with ALG-1(ma192) and ALG-1(ma202) is increased compared with wild-type ALG-1. AIN-1 and DCR-1 abundances in IPs are normalized to the abundance of ALG-1. (B) Venn diagram representation of the wild-type ALG-1–, ALG-1(ma192)–, and ALG-1(ma202)–associated proteins.
Fig. S1.
Fig. S1.
Scatterplots showing protein abundances (expressed as background-corrected NSAF values) for proteins detected by MudPIT proteomics in ALG-1 immunopreciptates from wild-type or alg-1(anti) extracts. (A) Wild-type ALG-1 vs. ALG-1(ma192). (B) Wild-type ALG-1 vs. ALG-1(ma202). (C) ALG-1(ma192) vs. ALG-1(ma202).
Fig. 2.
Fig. 2.
alg-1(anti) mutants show an accumulation of miR* strands in total RNA. (A) Northern blot analysis of total RNA extracted from wild-type and alg-1 mutants using probes against miR* strands (pre, precursor microRNA; int, intermediate species of microRNA processing presumably containing the passenger strand and the loop). (B and C) Deep-sequencing analysis of small RNA populations from wild-type, alg-1(ma192) and alg-1(ma202) mutant animals shows an increase in miR* populations (B) and loop accumulation (C) in the alg-1 mutants compared with wild-type. (D and E) Scatterplots showing fold-change in individual miR*/miR ratios between alg-1(anti) and wild-type total RNA. Increased miR*/miR ratio is seen in alg-1(ma192) (D) and alg-1(ma202) (E) mutants and is independent of microRNA abundance (ppm). Red dots represent microRNAs with an increased miR*/miR ratio in the alg-1 mutant over wild-type of at least twofold; green dots represent miRNAs with a decreased miR*/miR ratio in the alg-1 mutant compared with wild-type of at least twofold. Black dots represent no change in miR*/miR ratio in the alg-1 mutants compared with wild-type.
Fig. S2.
Fig. S2.
ALG-1(anti) associate with a greater amount of precursor microRNA processing byproducts; loops compared with wild-type ALG-1. (A and B) Scatterplots showing fold-change in individual loop/miR ratios between alg-1(anti) and wild-type total RNA. Increased loop/miR ratio is seen in alg-1(ma192) (A) and alg-1(ma202) (B) mutants and is independent of microRNA abundance. (C and D) Scatterplots showing fold-change in individual loop/miR ratios in material coimmunoprecipitated with ALG-1 from alg-1(anti) and wild-type. Increased loop/miR ratio is seen in alg-1(ma192) (C) and alg-1(ma202) (D) mutants and is independent of microRNA abundance. Red dots represent miRNAs with an increased loop/miR ratio in the alg-1 mutant over wild-type by at least twofold; green dots represent miRNAs with a decreased loop/miR ratio in the alg-1 mutant compared with wild-type by at least twofold. Black dots represent no change in loop/miR ratio in alg-1 mutants compared with wild-type.
Fig. S3.
Fig. S3.
Average miR*/miR ratio in alg-1(ma192) vs. alg-1(ma202) mutant total RNA (A–C) and ALG-1(ma192) vs. ALG-1(ma202) IP (D–F). B and C how progressive zooming of the graph in A. E and F show progressing zooming of the graph in D.
Fig. S4.
Fig. S4.
alg-1(anti) second larval (L2)-stage animals accumulate miR* strands. (A) miRNAs that showed asymmetry (miR*/miR >1) in the total RNA of alg-1(ma202) mixed-stage populations overlapped with miRNAs that showed asymmetry in the total RNA of alg-1(ma202) L2 stage animals. (B and C) Deep-sequencing analysis of cDNA libraries from small RNA populations shows an increase in miR* (B) and loop (C) levels in alg-1(ma192) and alg-1(ma202) animals compared with wild-type. (D and E) Scatterplots showing fold-change in individual miR*/miR ratios between alg-1(anti) and wild-type total RNA. Increased miR*/miR ratio is seen in alg-1(ma192) (D) and alg-1(ma202) (E) mutants and is independent of microRNA abundance. Red dots represent microRNAs with an increased miR*/miR ratio in the alg-1 mutant over wild-type of at least twofold; green dots represent miRNAs with a decreased miR*/miR ratio in the alg-1 mutant compared with wild-type of at least twofold. Black dots represent no change in miR*/miR ratio in the alg-1 mutants compared with wild-type. (F–H) Scatterplots showing miR*/miR ratios observed in mixed-stage vs. L2-staged populations in wild-type (F), alg-1(ma192) (G), and alg-1(ma202) (H) animals. F–H, Insets show zoomed-in graphs.
Fig. 3.
Fig. 3.
ALG-1(anti) Argonaute associates with miR* strands to a much greater degree than does wild-type ALG-1. (A and B) microRNAs are enriched (A), and tRNAs are de-enriched (B) in the ALG-1 IP compared with input. (C and D) ALG-1(anti) associates with a greater amount of miR* strands (C) and precursor microRNA loops (D) compared with the wild-type ALG-1. (E and F) Scatterplots showing fold-change in individual miR*/miR ratios in material coimmunoprecipitates with ALG-1 from alg-1(anti) and wild-type. Increased miR*/miR ratio for microRNAs associated with ALG-1 is exhibited for alg-1(ma192) (E) and alg-1(ma202) (F) mutants and is independent of microRNA abundance. Red dots represent miRNAs with an increased miR*/miR ratio in the alg-1 mutant over wild-type by at least twofold; green dots represent miRNAs with a decreased miR*/miR ratio in the alg-1 mutant compared with wild-type of at least twofold. Black dots represent no change in miR*/miR ratio in alg-1 mutants compared with wild-type. (G) Histograms showing miR-2 and miR-2*, as well as miR-58 and miR-58* strand association with immunoprecipitated wild-type and mutant ALG-1 protein.
Fig. 4.
Fig. 4.
2′O-methyl oligonucleotide pull-downs from wild-type and alg-1(anti) mutants suggest that miR-58* accumulation in ALG-1 is a result of failure of ALG-1(anti) to release it from the duplex. (A) Two models for miR* microRNA accumulation in alg-1(anti) mutant animals. Model I: ALG-1(anti) complexes retain both microRNA strands primarily in a bound duplex. Model II: ALG-1(anti) complexes contain single strands of miR and miR* microRNAs because of a loss in the ability of the protein to differentiate between the two strands. Predictions of the outcome for IP and pull-down experiments are shown directly below each model. (B) Protein yield of miRISC components and other small RNA related factors from mir-58 family microRNA pull-down as determined by MudPIT proteomics and normalized to the amount of RNA depleted by the 2′O-methyl pull-down. ALG-1 and ALG-2 protein yield as determined based on normalized spectral abundance factor (NSAF)unique (SI Materials and Methods). (C) Efficiency of the miR-58 and miR-58* strand pull-downs presented as percent microRNA depleted from the supernatant in samples shown in B. (D) Sequence alignments between members of the mir-58 family of microRNAs. (E) miR-58 family microRNA and miR* abundances in wild-type ALG-1 and ALG-1(anti) IP. (F) Western blot analysis of mir-58 microRNA family pull-downs from extracts of alg-1(anti) and wild-type animals showing association of ALG-1, DCR-1, and AIN-1 with mir-58 family microRNAs (-, scrambled oligo control; 58, oligo against miR-58; 58*, oligo against miR-58*). (G and H) Summary model for the miR-58* strand and related proteins accumulation as observed in alg-1(anti) mutants by (G) ALG-1(anti) IP and (H) miR-58 and miR-58* 2′O-methyl pull-downs (m, miR; m*, miR*).
Fig. S5.
Fig. S5.
Protein yield (represented as normalized NSAF values) of miRISC components and other small RNA related factors from mir-58 family microRNA pull-down from alg-1(ma202) mutant animals as determined by MudPIT proteomics.
Fig. S6.
Fig. S6.
Western blot analysis of mir-52 microRNA family pull-downs from extracts of alg-1(anti) and wild-type animals showing association of ALG-1, DCR-1, and AIN-1 with mir-52 family microRNAs (-, scrambled oligo control pull-down; 52, miR-52 pull-down; 52*, miR-52* pull-down).
Fig. 5.
Fig. 5.
2′-O-methyl oligonucleotide pull-downs from wild-type and alg-1(anti) mutants suggest that miR-2* accumulation in ALG-1 is in part a result of inappropriate loading into the ALG-1(anti) Argonaute. (A) mir-2 family microRNA and miR* abundances in wild-type ALG-1 and ALG-1(anti) IP. (B) Western blot analysis of miR-2 and miR-2* pull-downs from extracts of alg-1(anti) and wild-type animals showing association of ALG-1, DCR-1, and AIN-1 with mir-58 family microRNAs (-, scrambled oligo control; 2, oligo against miR-2; 2*, oligo against miR-2*). (C and D) Summary model for the miR-2* strand and related proteins accumulation as observed in alg-1(anti) mutants by (C) ALG-1(anti) IP and (D) miR-2 and miR-2* 2′O-methyl pull-downs.
Fig. S7.
Fig. S7.
microRNA feature analysis of microRNAs with a miR*/miR ratio of >1 in ALG-1(ma202) IP (termed asymmetric microRNAs) (class I in Table 1); classes II and III, microRNAs that showed an increase of miR*/microRNA ratio in ALG-1(ma202) compared with wild-type ALG-1 (accumulated) (Table 1); and the microRNAs whose miR*/microRNA ratio was not affected (termed “unaffected”) (class IV in Table 1). (A) The identity of the 5′ nucleotide of the guide microRNA. (B) The identity of the 5′ nucleotide of the miR* microRNA. (C) Precursor arm origin. (D) Duplex energies comparison between the asymmetric (class I in Table 1), accumulated (classes II and III in Table 1), and unaffected (class IV in Table 1) microRNA populations. (E) Differences in the end-pairing and duplex end energies (ΔΔG) of the three microRNA populations. PP, paired 5′ nucleotide of the microRNA, paired 5′ nucleotide of the miR*; PU, paired 5′ nucleotide of the microRNA, unpaired 5′ nucleotide of the miR*; UP, unpaired 5′ nucleotide, paired 5′ nucleotide of the miR*. Number in parenthesis represents the total number of microRNAs within each group. ΔΔG(kcal/mole) of two nucleotides at each end of duplex is plotted as a function of miR*/microRNA ratio for the microRNA duplexes that had paired nucleotides at each duplex end. (F) MicroRNA duplex examples of the four groups (PU, PP, UP, UU) shown in E. (G) ΔΔG(kcal/mole) of seed energies (ΔG of miR seed minus ΔG of miR* seed) is plotted as a function of miR*/miR ratio for the microRNA duplexes.
Fig. 6.
Fig. 6.
A model representing factors that influence the orientation of microRNA duplex loading.

Similar articles

Cited by

References

    1. Friedman RC, Farh KK-H, Burge CB, Bartel DP. Most mammalian mRNAs are conserved targets of microRNAs. Genome Res. 2009;19(1):92–105. - PMC - PubMed
    1. Maniataki E, De Planell Saguer MDA, Mourelatos Z. Immunoprecipitation of microRNPs and directional cloning of microRNAs. Methods Mol Biol. 2005;309:283–294. - PubMed
    1. Liu X, Jin D-Y, McManus MT, Mourelatos Z. Precursor microRNA-programmed silencing complex assembly pathways in mammals. Mol Cell. 2012;46(4):507–517. - PMC - PubMed
    1. Iwasaki S, et al. Defining fundamental steps in the assembly of the Drosophila RNAi enzyme complex. Nature. 2015;521(7553):533–536. - PubMed
    1. Martinez NJ, Chang H-M, Borrajo J de R, Gregory RI. The co-chaperones Fkbp4/5 control Argonaute2 expression and facilitate RISC assembly. RNA. 2013;19(11):1583–1593. - PMC - PubMed

Publication types

Associated data