

Identification of potential drug targets for tuberous sclerosis complex by synthetic screens combining CRISPR-based knockouts with RNAi
- PMID: 26350902
- PMCID: PMC4642709
- DOI: 10.1126/scisignal.aab3729
Identification of potential drug targets for tuberous sclerosis complex by synthetic screens combining CRISPR-based knockouts with RNAi
Abstract
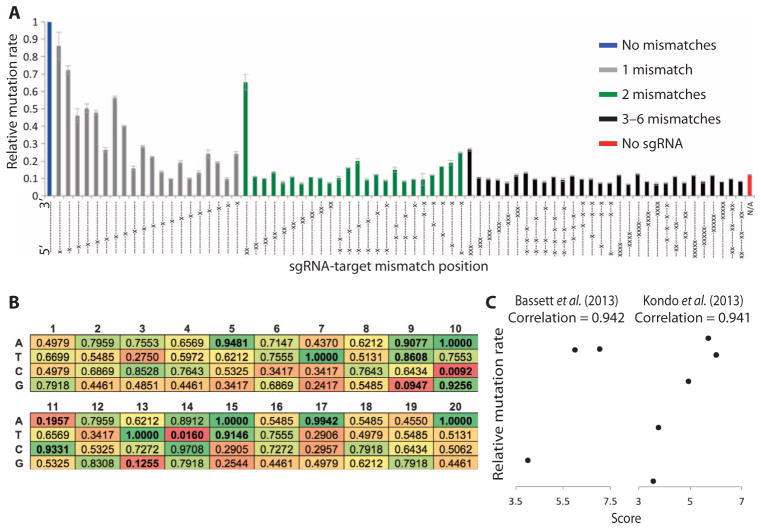
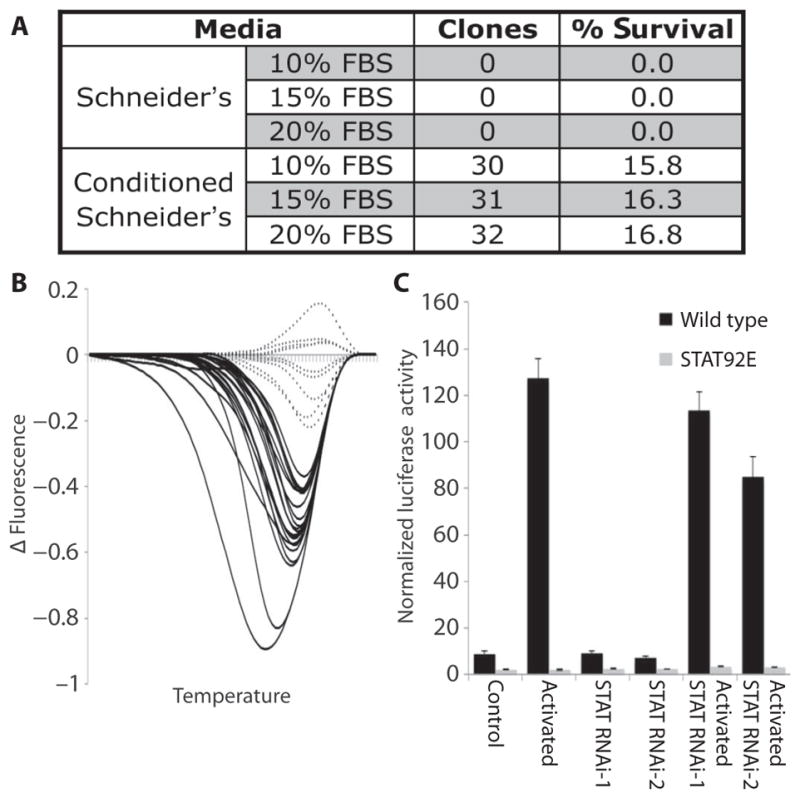
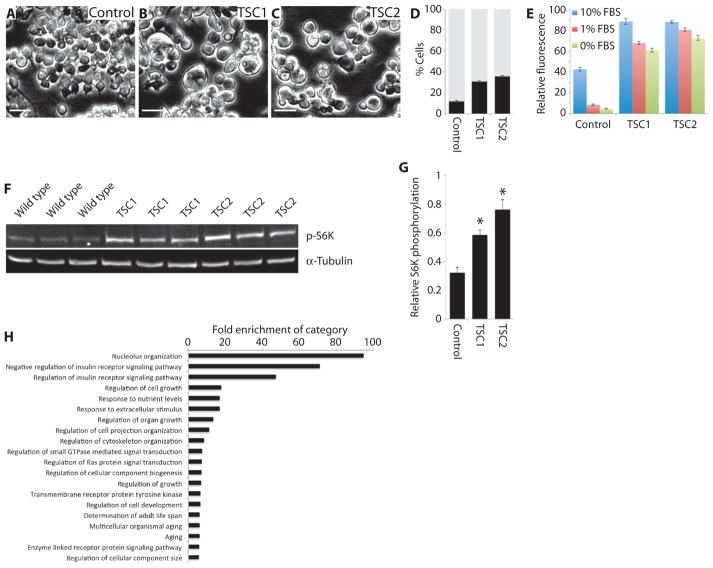
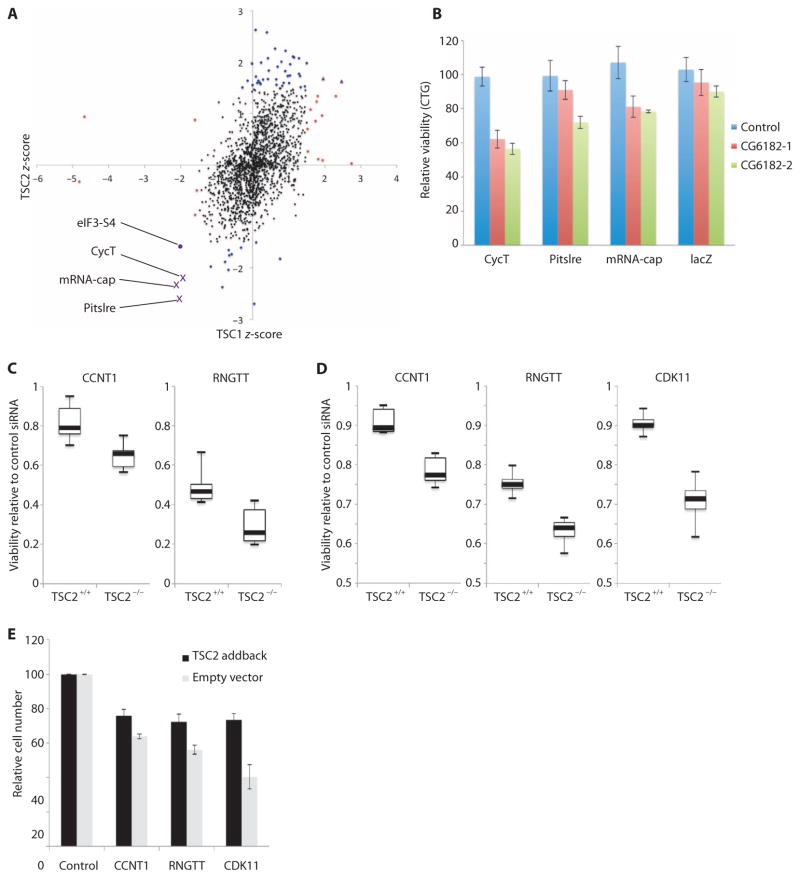
The tuberous sclerosis complex (TSC) family of tumor suppressors, TSC1 and TSC2, function together in an evolutionarily conserved protein complex that is a point of convergence for major cell signaling pathways that regulate mTOR complex 1 (mTORC1). Mutation or aberrant inhibition of the TSC complex is common in various human tumor syndromes and cancers. The discovery of novel therapeutic strategies to selectively target cells with functional loss of this complex is therefore of clinical relevance to patients with nonmalignant TSC and those with sporadic cancers. We developed a CRISPR-based method to generate homogeneous mutant Drosophila cell lines. By combining TSC1 or TSC2 mutant cell lines with RNAi screens against all kinases and phosphatases, we identified synthetic interactions with TSC1 and TSC2. Individual knockdown of three candidate genes (mRNA-cap, Pitslre, and CycT; orthologs of RNGTT, CDK11, and CCNT1 in humans) reduced the population growth rate of Drosophila cells lacking either TSC1 or TSC2 but not that of wild-type cells. Moreover, individual knockdown of these three genes had similar growth-inhibiting effects in mammalian TSC2-deficient cell lines, including human tumor-derived cells, illustrating the power of this cross-species screening strategy to identify potential drug targets.
Copyright © 2015, American Association for the Advancement of Science.
Conflict of interest statement
Figures
Similar articles
-
Upregulation of 6-phosphofructo-2-kinase (PFKFB3) by hyperactivated mammalian target of rapamycin complex 1 is critical for tumor growth in tuberous sclerosis complex.IUBMB Life. 2020 May;72(5):965-977. doi: 10.1002/iub.2232. Epub 2020 Jan 20. IUBMB Life. 2020. PMID: 31958214
-
Tuberous sclerosis complex activity is required to control neuronal stress responses in an mTOR-dependent manner.J Neurosci. 2009 May 6;29(18):5926-37. doi: 10.1523/JNEUROSCI.0778-09.2009. J Neurosci. 2009. PMID: 19420259 Free PMC article.
-
Tuberous sclerosis complex: from Drosophila to human disease.Trends Cell Biol. 2004 Feb;14(2):78-85. doi: 10.1016/j.tcb.2003.12.006. Trends Cell Biol. 2004. PMID: 15102439 Review.
-
Translatome analysis of tuberous sclerosis complex 1 patient-derived neural progenitor cells reveals rapamycin-dependent and independent alterations.Mol Autism. 2023 Oct 25;14(1):39. doi: 10.1186/s13229-023-00572-3. Mol Autism. 2023. PMID: 37880800 Free PMC article.
-
Tuberous sclerosis gene products in proliferation control.Mutat Res. 2001 Jul;488(3):233-9. doi: 10.1016/s1383-5742(01)00058-8. Mutat Res. 2001. PMID: 11397651 Review.
Cited by
-
HIF-independent synthetic lethality between CDK4/6 inhibition and VHL loss across species.Sci Signal. 2019 Oct 1;12(601):eaay0482. doi: 10.1126/scisignal.aay0482. Sci Signal. 2019. PMID: 31575731 Free PMC article.
-
Generating and working with Drosophila cell cultures: Current challenges and opportunities.Wiley Interdiscip Rev Dev Biol. 2019 May;8(3):e339. doi: 10.1002/wdev.339. Epub 2018 Dec 18. Wiley Interdiscip Rev Dev Biol. 2019. PMID: 30561900 Free PMC article. Review.
-
RNA Interference (RNAi) Screening in Drosophila.Genetics. 2018 Mar;208(3):853-874. doi: 10.1534/genetics.117.300077. Genetics. 2018. PMID: 29487145 Free PMC article.
-
Optimized strategy for in vivo Cas9-activation in Drosophila.Proc Natl Acad Sci U S A. 2017 Aug 29;114(35):9409-9414. doi: 10.1073/pnas.1707635114. Epub 2017 Aug 14. Proc Natl Acad Sci U S A. 2017. PMID: 28808002 Free PMC article.
-
SNP-CRISPR: A Web Tool for SNP-Specific Genome Editing.G3 (Bethesda). 2020 Feb 6;10(2):489-494. doi: 10.1534/g3.119.400904. G3 (Bethesda). 2020. PMID: 31822517 Free PMC article.
References
-
- Crino PB, Nathanson KL, Henske EP. The tuberous sclerosis complex. N Engl J Med. 2006;355:1345–1356. - PubMed
-
- McCormack FX, Inoue Y, Moss J, Singer LG, Strange C, Nakata K, Barker AF, Chapman JT, Brantly ML, Stocks JM, Brown KK, Lynch JP, III, Goldberg HJ, Young LR, Kinder BW, Downey GP, Sullivan EJ, Colby TV, McKay RT, Cohen MM, Korbee L, Taveira-DaSilva AM, Lee H-S, Krischer JP, Trapnell BC National Institutes of Health Rare Lung Diseases Consortium; MILES Trial Group. Efficacy and safety of sirolimus in lymphangioleiomyomatosis. N Engl J Med. 2011;364:1595–1606. - PMC - PubMed
-
- Krueger DA, Care MM, Holland K, Agricola K, Tudor C, Mangeshkar P, Wilson KA, Byars A, Sahmoud T, Franz DN. Everolimus for subependymal giant-cell astrocytomas in tuberous sclerosis. N Engl J Med. 2010;363:1801–1811. - PubMed
Publication types
MeSH terms
Substances
Grants and funding
LinkOut - more resources
Full Text Sources
Other Literature Sources
Medical
Molecular Biology Databases
Miscellaneous
