

Multiple Reaction Monitoring Enables Precise Quantification of 97 Proteins in Dried Blood Spots
- PMID: 26342038
- PMCID: PMC4638049
- DOI: 10.1074/mcp.O115.049957
Multiple Reaction Monitoring Enables Precise Quantification of 97 Proteins in Dried Blood Spots
Abstract
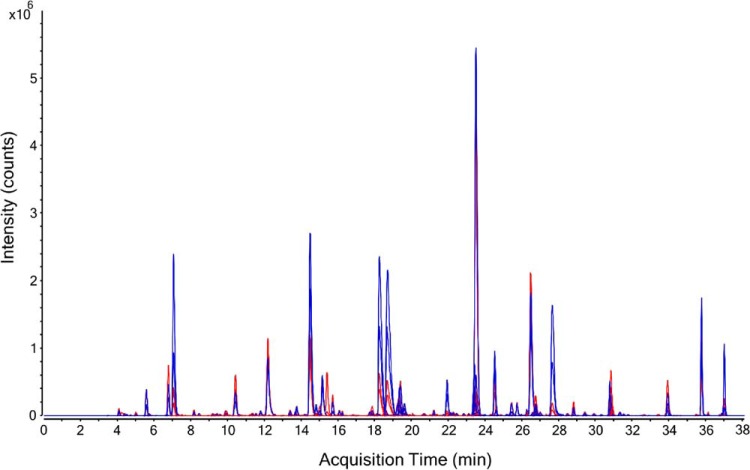
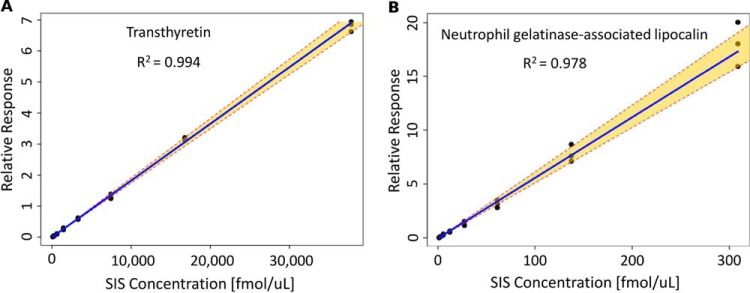
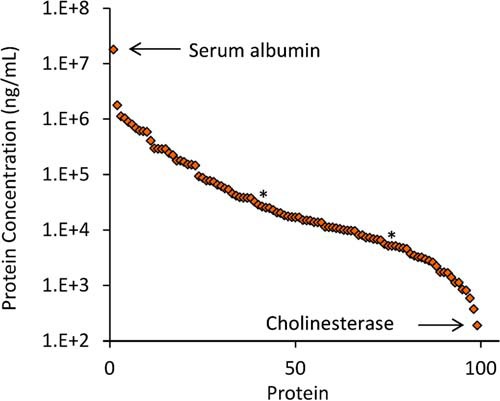
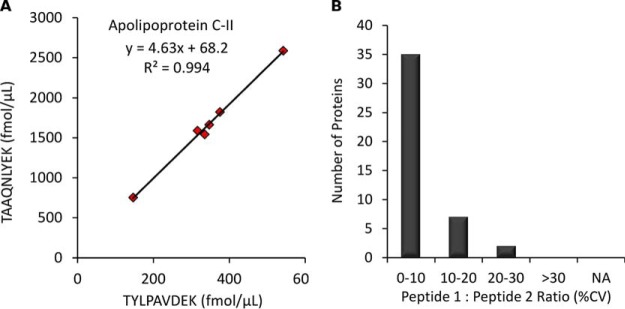
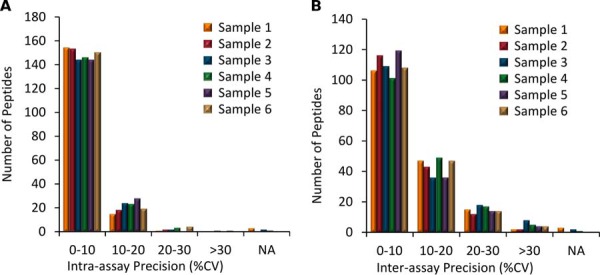
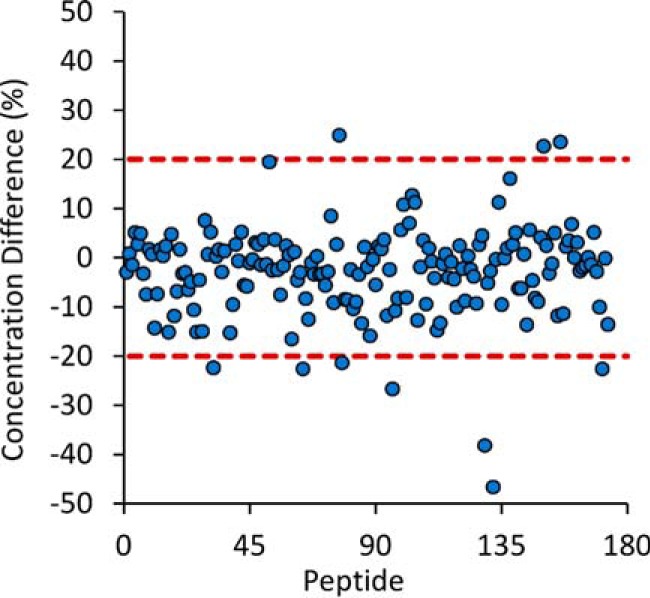
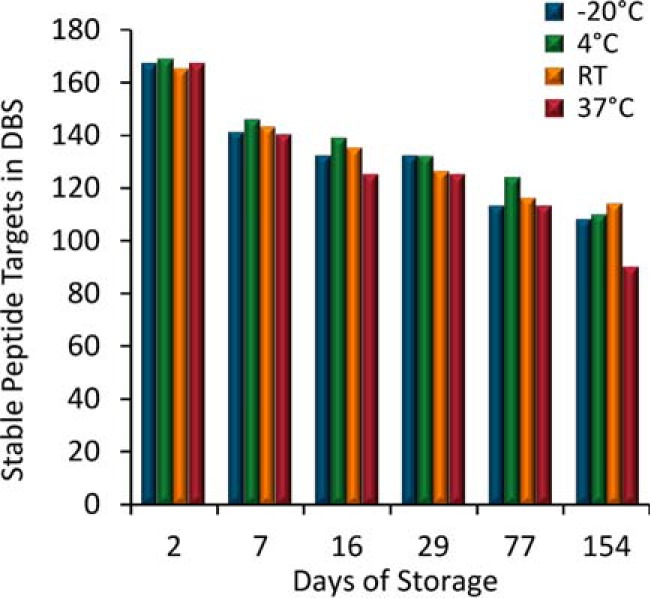
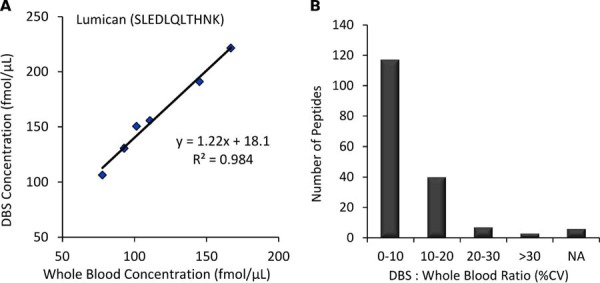
The dried blood spot (DBS) methodology provides a minimally invasive approach to sample collection and enables room-temperature storage for most analytes. DBS samples have successfully been analyzed by liquid chromatography multiple reaction monitoring mass spectrometry (LC/MRM-MS) to quantify a large range of small molecule biomarkers and drugs; however, this strategy has only recently been explored for MS-based proteomics applications. Here we report the development of a highly multiplexed MRM assay to quantify endogenous proteins in human DBS samples. This assay uses matching stable isotope-labeled standard peptides for precise, relative quantification, and standard curves to characterize the analytical performance. A total of 169 peptides, corresponding to 97 proteins, were quantified in the final assay with an average linear dynamic range of 207-fold and an average R(2) value of 0.987. The total range of this assay spanned almost 5 orders of magnitude from serum albumin (P02768) at 18.0 mg/ml down to cholinesterase (P06276) at 190 ng/ml. The average intra-assay and inter-assay precision for 6 biological samples ranged from 6.1-7.5% CV and 9.5-11.0% CV, respectively. The majority of peptide targets were stable after 154 days at storage temperatures from -20 °C to 37 °C. Furthermore, protein concentration ratios between matching DBS and whole blood samples were largely constant (<20% CV) across six biological samples. This assay represents the highest multiplexing yet achieved for targeted protein quantification in DBS samples and is suitable for biomedical research applications.
© 2015 by The American Society for Biochemistry and Molecular Biology, Inc.
Figures
Similar articles
-
Multiplexed quantitation of endogenous proteins in dried blood spots by multiple reaction monitoring-mass spectrometry.Mol Cell Proteomics. 2013 Mar;12(3):781-91. doi: 10.1074/mcp.M112.022442. Epub 2012 Dec 7. Mol Cell Proteomics. 2013. PMID: 23221968 Free PMC article.
-
Towards reproducible MRM based biomarker discovery using dried blood spots.Sci Rep. 2017 Mar 27;7:45178. doi: 10.1038/srep45178. Sci Rep. 2017. PMID: 28345601 Free PMC article.
-
Rapid Multiplexed Proteomic Screening for Primary Immunodeficiency Disorders From Dried Blood Spots.Front Immunol. 2018 Dec 4;9:2756. doi: 10.3389/fimmu.2018.02756. eCollection 2018. Front Immunol. 2018. PMID: 30564228 Free PMC article.
-
The use of mass spectrometry to analyze dried blood spots.Mass Spectrom Rev. 2016 May-Jun;35(3):361-438. doi: 10.1002/mas.21441. Epub 2014 Sep 22. Mass Spectrom Rev. 2016. PMID: 25252132 Review.
-
The application of fully automated dried blood spot analysis for liquid chromatography-tandem mass spectrometry using the CAMAG DBS-MS 500 autosampler.Clin Biochem. 2020 Aug;82:33-39. doi: 10.1016/j.clinbiochem.2020.02.007. Epub 2020 Feb 19. Clin Biochem. 2020. PMID: 32087137 Review.
Cited by
-
Genome-wide postnatal changes in immunity following fetal inflammatory response.FEBS J. 2021 Apr;288(7):2311-2331. doi: 10.1111/febs.15578. Epub 2020 Oct 24. FEBS J. 2021. PMID: 33006196 Free PMC article.
-
Recent developments in mass-spectrometry-based targeted proteomics of clinical cancer biomarkers.Clin Proteomics. 2024 Jan 30;21(1):6. doi: 10.1186/s12014-024-09452-1. Clin Proteomics. 2024. PMID: 38287260 Free PMC article. Review.
-
Review of Liquid Chromatography-Mass Spectrometry-Based Proteomic Analyses of Body Fluids to Diagnose Infectious Diseases.Int J Mol Sci. 2022 Feb 16;23(4):2187. doi: 10.3390/ijms23042187. Int J Mol Sci. 2022. PMID: 35216306 Free PMC article. Review.
-
Concentration Determination of >200 Proteins in Dried Blood Spots for Biomarker Discovery and Validation.Mol Cell Proteomics. 2020 Mar;19(3):540-553. doi: 10.1074/mcp.TIR119.001820. Epub 2020 Jan 2. Mol Cell Proteomics. 2020. PMID: 31896676 Free PMC article.
-
Dynamic and temporal assessment of human dried blood spot MS/MSALL shotgun lipidomics analysis.Nutr Metab (Lond). 2017 Mar 20;14:28. doi: 10.1186/s12986-017-0182-6. eCollection 2017. Nutr Metab (Lond). 2017. PMID: 28344632 Free PMC article.
References
-
- McDade T. W., Williams S., and Snodgrass J. J. (2007) What a Drop Can Do: Dried Blood Spots as a Minimally Invasive Method for Integrating Biomarkers into Population-Based Research. Demography 44, 899–925 - PubMed
-
- Demirev P. A. (2013) Dried blood spots: analysis and applications. Anal. Chem. 85, 779–789 - PubMed
-
- Chace D. H., Kalas T. A., and Naylor E. W. (2003) Use of tandem mass spectrometry for multianalyte screening of dried blood specimens from newborns. Clin. Chem. 49, 1797–1817 - PubMed
-
- Lehotay D. C., Hall P., Lepage J., Eichhorst J. C., Etter M. L., and Greenberg C. R. (2011) LC-MS/MS progress in newborn screening. Clin. Biochem. 44, 21–31 - PubMed
-
- Edelbroek P. M., van der Heijden J., and Stolk L. M. L. (2009) Dried Blood Spot Methods in Therapeutic Drug Monitoring: Methods, Assays, and Pitfalls. Ther. Drug Monit. 31, 327–336 - PubMed
Publication types
MeSH terms
Substances
LinkOut - more resources
Full Text Sources
