. 2015 Sep 5:16:681.
doi: 10.1186/s12864-015-1882-9.

Genome-wide target analysis of NEUROD2 provides new insights into regulation of cortical projection neuron migration and differentiation

Affiliations

Genome-wide target analysis of NEUROD2 provides new insights into regulation of cortical projection neuron migration and differentiation

Efil Bayam et al. BMC Genomics. .

Abstract

Background: Cellular differentiation programs are controlled, to a large extent, by the combinatorial functioning of specific transcription factors. Cortical projection neurons constitute the major excitatory neuron population within the cortex and mediate long distance communication between the cortex and other brain regions. Our understanding of effector transcription factors and their downstream transcriptional programs that direct the differentiation process of cortical projection neurons is far from complete.

Results: In this study, we carried out a ChIP-Seq (chromatin-immunoprecipitation and sequencing) analysis of NEUROD2, an effector transcription factor expressed in lineages of cortical projection neurons during the peak of cortical excitatory neurogenesis. Our results suggest that during cortical development NEUROD2 targets key genes that are required for Reelin signaling, a major pathway that regulates the migration of neurons from germinal zones to their final layers of residence within the cortex. We also find that NEUROD2 binds to a large set of genes with functions in layer-specific differentiation and in axonal pathfinding of cortical projection neurons.

Conclusions: Our analysis of in vivo NEUROD2 target genes offers mechanistic insight into signaling pathways that regulate neuronal migration and axon guidance and identifies genes that are likely to be required for proper cortical development.


Figures
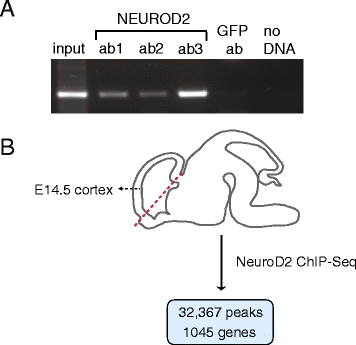
Fig. 1
Fig. 1
ChIP-Seq reveals NEUROD2 target genes during cortical development. a Chromatin DNA was immunoprecipitated with three different antibodies against NEUROD2 (ab1, ab2 or ab3) or with a GFP antibody which was used as a negative control. PCR was performed using immunoprecipitated DNA as template. Specific primers amplified the promoter region of a previously identified NEUROD2 target gene Nhlh2 [16]. An enrichment for the positive control Nhlh2 gene was demonstrated in NEUROD2 ChIP-PCR samples as compared to GFP ChIP-PCR. b The developing cortex (dorsal telencephalon) was dissected from E14.5 mouse brain and used for NEUROD2 ChIP-Seq. 32,367 peak regions and 1,045 target genes were identified
Fig. 2
Fig. 2
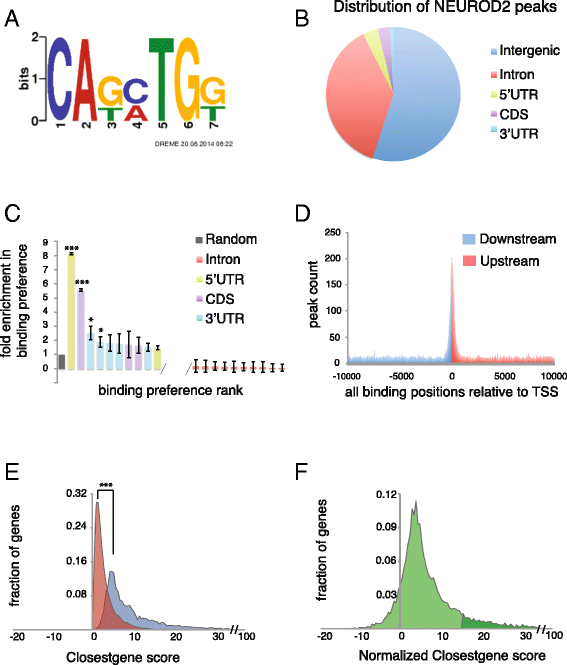
NEUROD2 binds to E-box elements proximal to TSSs in vivo. a NEUROD2 consensus sequence was predicted using 32,367 peak regions as input for the MEME-ChIP suite [23]. b Among the 32,367 NEUROD2 peaks, approximately 45 % mapped onto Ensembl annotated genes (mm10 reference genome) [24, 55]. Among them approximately 83 % mapped onto introns, and 17 % to either 5′UTR, CDS or 3′UTR exons. c The binding preference of NEUROD2 to introns, 5′UTR exons, 3′UTR exons and CDS exons was calculated. The number of NEUROD2 binding sites observed on introns (red), 5′UTR (green), 3′UTR (blue) and CDS (purple) exons were normalized to the length of each of these gene segments and compared to a random distribution profile (grey bar). The data suggests approximately an 8-fold enrichment in NEUROD2 binding to the first 5′UTR exon, a 5-fold enrichment in binding to the first CDS exon and approximately 2-fold enrichment in binding to the first and second 3′UTR exons. ***p-value ~ 0, *p-value < 0.001. d A binding map of NEUROD2 relative to closest TSSs, revealed that NEUROD2 has a binding preference within +/− 1000 bps of TSSs. Peaks that mapped upstream (blue) and downstream (red) of TSSs are color-coded. e The distribution profiles of ClosestGene scores [29] calculated by using NEUROD2 peaks (blue) were very significantly different from those calculated using randomly distributed peaks (red) on the genome (***p-value ~ 0). f Distribution of normalized scores for individual genes were generated by subtracting the ClosestGene score calculated using NEUROD2 peaks from that of random peaks. Dark green represents genes whose scores were greater than one standard deviation (σ) above the mean and were used for further analyses
Fig. 3
Fig. 3
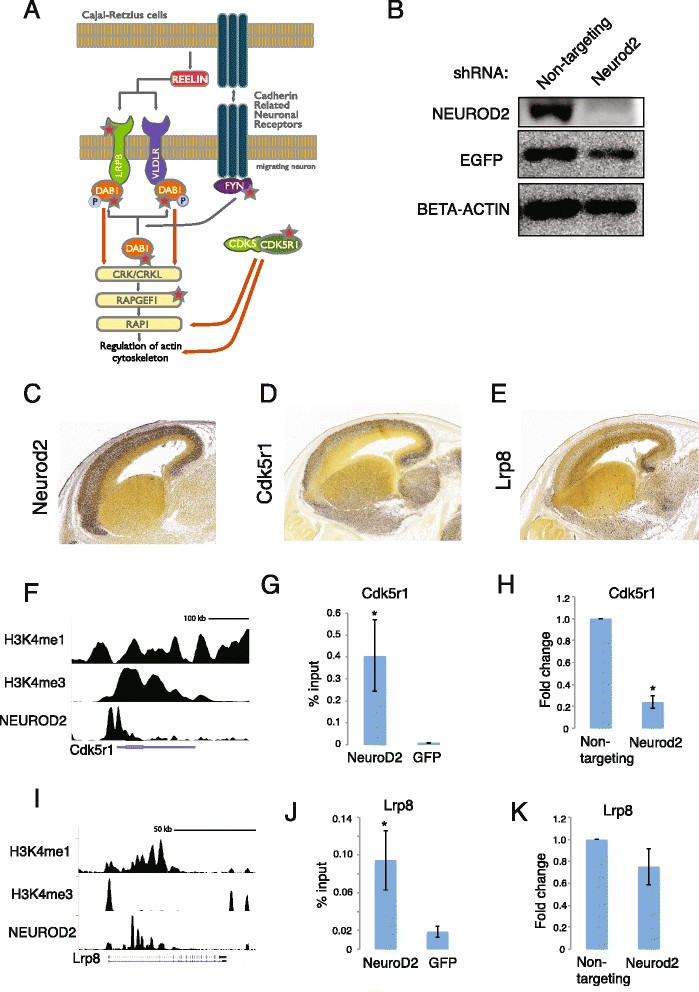
NEUROD2 targets Cdk5r1 and Lrp8 genes during corticogenesis. a Diagrammatic representation of the Reelin signaling pathway that is required for cortical radial migration. Genes that are targets of NEUROD2 are marked with a red star. b NEUROD2 western blotting confirms knockdown in primary cortical neuronal culture transfected with Neurod2 shRNA as compared to a non-targeting shRNA. EGFP is used to verify transfection efficiency and BETA-ACTIN is used as a loading control. c, d and e mRNA expression data is obtained from Allen Developing Mouse Brain Atlas (http://developingmouse.brain-map.org) for Neurod2, Cdk5r1 and Lrp8 genes in E15.5 mouse brain. f and i NEUROD2 peaks associated with Cdk5r1 and Lrp8 are plotted relative to enhancer (H3K4me1) and promoter (H3K4me3) marks. H3K4me1 and H3K4me3 ChIP-Seq data is from (www.encodeproject.org) [31]. Peaks are plotted using the genome browser at genome.ucsc.edu. g and j NEUROD2 ChIP followed by qPCR confirms NEUROD2 binding to the promoter regions of Cdk5r1 and Lrp8 relative to a negative control (GFP ChIP). Data is normalized to the amount of input DNA as described in the Methods section (p-value < 0.05). Bars represent standard error of mean. Data represents two biological and five technical replicates. h and k Reverse transcription and qPCR analysis of neurons transfected with Neurod2 shRNA or non-targeting shRNA reveals a significant reduction in Cdk5r1 mRNA levels (p-value = 9.6x10⁻⁸) and a trend of reduction in Lrp8 levels (p-value = 0.18) after Neurod2 knockdown. All RT-qPCR results represented data from 3 biological samples each analyzed in technical triplicates. Bars represent standard error of mean
Fig. 4
Fig. 4
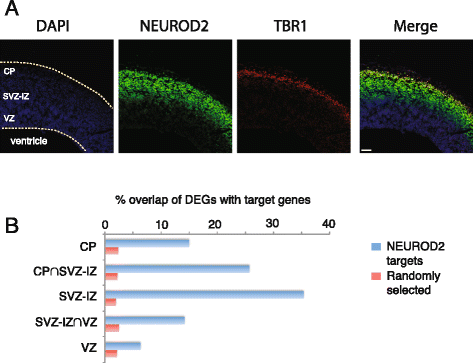
NEUROD2 target genes are enriched in the subventricular-intermediate zone of the developing cortex. a Immunofluorescent staining against NEUROD2 and TBR1, and DAPI staining on coronal sections prepared from E14.5 mouse brain. NEUROD2 positive neurons are observed in the SVZ-IZ region of the developing cortex. Scale bar, 62 μm. b The percentage of overlap between NEUROD2 target genes and differentially expressed genes (DEGs) in the cortical plate (CP), subventricular zone/intermediate zone (SVZ-IZ), ventricular zone (VZ), and those that are preferentially expressed in two regions (CP∩SVZ-IZ and SVZ-IZ∩VZ) are plotted. NEUROD2 target genes (in blue) display an enrichment in DEGs of the different cortical regions (in particular the SVZ-IZ region) as compared to randomly selected genes (in red) from the mouse genome
Fig. 5
Fig. 5
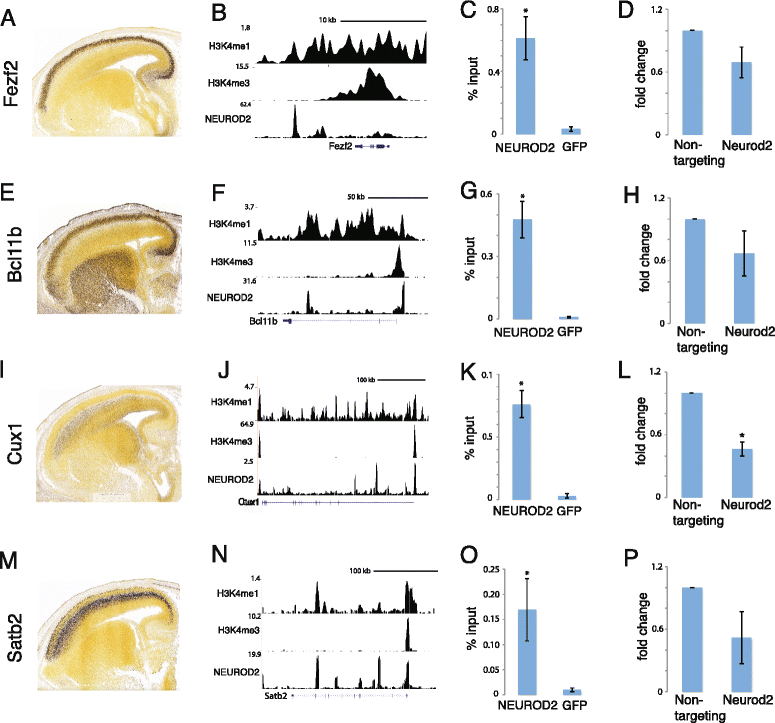
NEUROD2 target genes encode transcription factors that control the differentiation of distinct populations of cortical layer specific projection neurons. mRNA expression data is obtained from Allen Developing Mouse Brain Atlas (http://developingmouse.brain-map.org) for Fezf2 (a), Bcl11b (e), Cux1 (i) and Satb2 (m) for E15.5 mouse brain. Neurod2 expression overlaps with the domains expressing each of the cortical layer specific transcription factors. (b, f, j and n) NEUROD2 peaks are plotted relative to enhancer (H3K4me1) and promoter (H3K4me3) marks. H3K4me1 and H3K4me3 ChIP-Seq data is from (www.encodeproject.org) [31]. Peaks are plotted using the genome browser at genome.ucsc.edu. (c, g, k and o) NEUROD2 ChIP followed by qPCR confirms NEUROD2 binding to the promoter regions of all four layer markers relative to a negative control (GFP ChIP) (p-value < 0.05). Data is normalized to the amount of input DNA as described in the Methods section. Bars represent standard error of mean. Data represents two biological and five technical replicates. (d, h, l and p) mRNA levels of Fezf2, Bcl11b, Cux1 and Satb2 were quantified by RT-qPCR in neurons transfected with either a non-targeting or a Neurod2 shRNA. A significant reduction in Cux1 mRNA levels was observed in the absence of NEUROD2. Each experiment represents 3 biological samples each analyzed in technical triplicates. Data is presented as fold change of control sample (* p-value = 0.0014). p-values for changes in expression of Fezf2, Bcl11b and Satb2 were between 0.1 and 0.2. A non-targeting shRNA was used as control. Bars are standard error of the mean

Similar articles

Cited by

References

    1. Huang Z. Molecular regulation of neuronal migration during neocortical development. Mol Cell Neurosci. 2009;42:11–22. doi: 10.1016/j.mcn.2009.06.003. - DOI - PubMed
    1. Leyva-Diaz E, Lopez-Bendito G. In and out from the cortex: development of major forebrain connections. Neuroscience. 2013;254:26–44. doi: 10.1016/j.neuroscience.2013.08.070. - DOI - PubMed
    1. Leone DP, Srinivasan K, Chen B, Alcamo E, McConnell SK. The determination of projection neuron identity in the developing cerebral cortex. Curr Opin Neurobiol. 2008;18:28–35. doi: 10.1016/j.conb.2008.05.006. - DOI - PMC - PubMed
    1. Kwan KY, Sestan N, Anton ES. Transcriptional co-regulation of neuronal migration and laminar identity in the neocortex. Development. 2012;139:1535–46. doi: 10.1242/dev.069963. - DOI - PMC - PubMed
    1. Yuan L, Hassan BA. Neurogenins in brain development and disease: an overview. Arch Biochem Biophys. 2014;558:10–3. doi: 10.1016/j.abb.2014.05.028. - DOI - PubMed

Publication types

MeSH terms