. 2015 Nov:485:340-54.
doi: 10.1016/j.virol.2015.08.003. Epub 2015 Aug 29.

Breaking resistance of pancreatic cancer cells to an attenuated vesicular stomatitis virus through a novel activity of IKK inhibitor TPCA-1

Affiliations

Breaking resistance of pancreatic cancer cells to an attenuated vesicular stomatitis virus through a novel activity of IKK inhibitor TPCA-1

Marcela Cataldi et al. Virology. 2015 Nov.

Abstract

Vesicular stomatitis virus (VSV) is an effective oncolytic virus against most human pancreatic ductal adenocarcinoma (PDAC) cell lines. However, some PDAC cell lines are highly resistant to oncolytic VSV-ΔM51 infection. To better understand the mechanism of resistance, we tested a panel of 16 small molecule inhibitors of different cellular signaling pathways, and identified TPCA-1 (IKK-β inhibitor) and ruxolitinib (JAK1/2 inhibitor), as strong enhancers of VSV-ΔM51 replication and virus-mediated oncolysis in all VSV-resistant PDAC cell lines. Both TPCA-1 and ruxolitinib similarly inhibited STAT1 and STAT2 phosphorylation and decreased expression of antiviral genes MxA and OAS. Moreover, an in situ kinase assay provided biochemical evidence that TPCA-1 directly inhibits JAK1 kinase activity. Together, our data demonstrate that TPCA-1 is a unique dual inhibitor of IKK-β and JAK1 kinase, and provide a new evidence that upregulated type I interferon signaling plays a major role in resistance of pancreatic cancer cells to oncolytic viruses.

Keywords: IKK inhibitor; Interferon signaling; Janus kinase (JAK); NF-kappa B (NF-κB); Oncolytic virus; Pancreatic cancer; Ruxolitinib; TPCA-1; Vesicular stomatitis virus.


Figures

Fig. 1
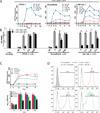
Fig. 1. Effect of TPCA-1, ruxolitinib and Jak Inh. I on VSV-infected HPAF-II
A) Cells were treated with serial dilutions of each inhibitor for 48 h prior infection with VSV-ΔM51-GFP (cell specific MOI 0.001). GFP fluorescence was measured and background fluorescence from uninfected treated cells was subtracted at each time point p.i. (*) indicates statistical significance (p < 0.05) between treatment and no treated cells (0 µM) at 48 and 72 h p.i. B) Cell viability was analyzed by MTT assay at 5 days p.i. and is plotted as percentage of the uninfected treated with no drug control. The assays were done in triplicate and data represent the mean ± SD of mean. (*) indicates statistical significance (p < 0.05) between infected and uninfected cells within the same treatment. C) Cells were infected with VSV-ΔM51-GFP at cell specific MOI 0.01 for 1 h, then treated with TPCA-1 (8 µM), ruxolitinib (2.5 µM) or JAK Inh. I (2.5 µM). Treatment was maintained until the end of the experiment. GFP fluorescence was measured at the specified time point p.i. (*) indicates statistical significance (p < 0.05) between treatment and no treated cells (no drug) at 48 and 72 h p.i. Media from infected cells were collected at 8, 24, 48, and 72 h p.i. and new infectious viral particle production was determined by plaque assay on BHK-21 cells. Titers were determined in duplicate and data represent the mean ± SD of mean. (*) indicates statistical significance (p < 0.05) between inhibitor treated and untreated (no drug) cells within the same time point p.i. D) Cells were treated with no drug or with TPCA-1 (8 µM), ruxolitinib (2.5 µM), or JAK Inh. I (2.5 µM) for 48 h before infection with VSV-ΔM51-GFP (cell specific MOI 0.001). Percentage of GFP positive cells was determined by flow cytometry at 48 h p.i. Gated populations are positive for GFP. The assay was done in triplicate and data represent the mean ± SD of mean.
Fig. 2
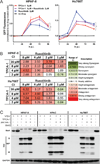
Fig. 2. Effect of TPCA-1, ruxolitinib and JAK Inh. I on four different VSV-resistant PDAC cell lines
CFPAC-1, HPAC, Hs766T and HPAF-II cells were treated with TPCA-1, ruxolitinib or JAK Inh. I for 48 h before infection with VSV-ΔM51-GFP at MOI 1.5 (based on BHK-21 cells). Cell specific MOIs are MOI 0.008 based on CFPAC, MOI 0.005 based on HPAC, MOI 0.003 based on Hs766T and MOI 0.001 based on HPAF-II. A) GFP fluorescence was measured and background fluorescence from uninfected treated cells was subtracted at each time point p.i. (*) indicates statistical significance (p < 0.05) between treatment and no treated cells (0 µM) at 48 h p.i. B) Cell viability was analyzed by MTT assay at 5 days p.i., and is expressed as percent of the uninfected treated with no drug control. Results in each row correspond to the same cell line as in A. The assays were done in triplicate and data represent the mean ± SD of mean. (*) indicates statistical significance (p < 0.05) between infected and uninfected cells within the same treatment.
Fig. 3
Fig. 3. Effect of inhibitor treatment timings on VSV infection and oncolysis in VSV-resistant PDAC cells
A) HPAF-II and Hs766T cells were seeded 3 days before infection (d−3) and treated with TPCA-1 (8 µM), ruxolitinib (2.5 µM) or JAK Inh. I (2.5 µM) for 0, 1, or 2 days before infection with VSV-ΔM51-GFP at MOI 1.5 (based on BHK-21 cells). Cell specific MOIs are MOI 0.003 based on Hs766T and MOI 0.001 based on HPAF-II. Virus was removed after 1 h and replaced with either media with inhibitor or no drug (see Treatment Schedule). GFP fluorescence was measured at each time point p.i. Statistical significances (p < 0.05) between treatment schedules and the treatment schedule 6 (no drug) at 48 (*) and 72 (#) h p.i. are indicated. Cell viability was analyzed in HPAF-II cells by MTT assay at 120 h p.i., and is showed as percentage of cells treated with no drug. The assays were done in triplicate and data represent the mean ± SD of mean. (*) indicates statistical significance (p < 0.05) between inhibitor treated and untreated cells (no drug) within the same treatment schedule. B) HPAF-II cells were seeded 2 days before infection (d−2) and treated with TPCA-1 (8 µM), ruxolitinib (2.5 µM) or JAK Inh. I (2.5 µM) for 1 day before infection with VSV-ΔM51-GFP (cell specific MOI 0.001). Virus was removed after 1 h and replaced with either media with inhibitor or no drug. Every 24 h p.i. media was removed and replaced with either media with inhibitor or no drug (see Treatment Schedule). GFP fluorescence was measured at each time point p.i. The assays were done in triplicate and data represent the mean ± SD of mean. Statistical significances (p < 0.05) between treatment schedules and the treatment schedule 7 (no drug) at 48 h (*) and 72 h (#) are indicated.
Fig. 4
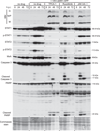
Fig. 4. Effect of inhibitors on protein and mRNA levels in HPAF-II
A) Cells were treated with TPCA-1 (8 µM), IKK-16 (0.8 µM), IKK Inh. XIII (0.8 µM), IKK-2 Inh. VIII (8 µM), BMS-345541 (4 µM), Sulfasalazine (4 mM), SAHA (8 µM), Celecoxib (80 µM), Rapamycin (80 nM), ruxolitinib (2.5 µM) or JAK Inh. I (2.5 µM) for 48 h. Cells lysates were prepared and analyzed by western blot for the indicated protein. Protein sizes (kDa) are indicated on the right. B) Cells were treated with TPCA (8 µM), SC-514 (80 µM), IKK-16 (0.8 µM), IKK Inh. XIII (0.8 µM), IKK-2 Inh. VIII (8 µM), IMD-0354 (0.8 µM), or BMS-345541 (4 µM) for 2 h prior to addition of TNF-α (25 ng/ml) or IFN-α (5000 U/ml). Cells were harvested at 4 h post-induction and extracted mRNA was reverse transcribed and analyzed by PCR.
Fig. 5
Fig. 5. Effect of TPCA-1 and JAK inhibitors combination treatment on PDAC cells
HPAF-II and Hs766T cells were treated with TPCA-1, ruxolitinib, or TPCA-1 and ruxolitinib combined. Treatment was started 1 day before infection with VSV-ΔM51-GFP (cell specific MOI 0.001), and maintained for 4 days p.i.. A) GFP fluorescence was measured and normalized to cells treated with no drug at each time point p.i. Assays were done in triplicate and data represent the mean ± SD of mean. (*) indicates statistical significance (p < 0.05) between treatment and no treated cells (no drug) at 48 and 72 h p.i. B) Combination Indexes (CI) calculated using the method of Chou-Talalay using VSV-driven GFP values at 48h p.i. Range of CI is as described by Chou and Talalay (Chou, 2006). C) HPAF-II, HPAC and Hs766T cells were treated with TPCA-1 (8 µM), JAK Inh. I (2.5 µM), BMS-345541 (BMS) (4 µM), or TPCA-1 and JAK Inh. I combined for 2 days before infection with VSV-ΔM51-GFP at MOI 15 (based on BHK-21 cells). Cell specific MOIs are MOI 0.01 based on HPAF-II, MOI 0.05 based on HPAC, and MOI 0.03 based on Hs766T. Cells lysates were prepared 2 days p.i, and analyzed by western blot for the indicated proteins.
Fig. 6
Fig. 6. TPCA-1 directly inhibits the JAK/STAT signaling pathway
HPAF-II cells were treated with TPCA-1 (8 µM), ruxolitinib (2.5 µM), or JAK Inh. I (2.5 µM) for 2 h prior to induction with either TNF-α (25 ng/ml) or IFN-α (5000 U/ml). Cells were harvested at 4 h post-induction. A) Relative gene expression was analyzed by real-time PCR and normalized to GAPDH expression. Fold change expression was calculated by the comparative Ct method. B) Cell lysates were prepared and analyzed by western blot for the indicated protein. Protein sizes (kDa) are indicated on the right. C) HPAF-II cells were treated with TPCA-1 (8 µM), ruxolitinib (2.5 µM), or JAK Inh. I (2.5 µM) for 2 h prior to induction with IFN-α (5000U/ml) for the indicated time. Cells were harvested and nuclear extracts were subjected to EMSA using a radiolabeled ISRE probe. D) In situ titration of TPCA-1, Ruxolitinib and BMS-345541 were performed with recombinant human JAK1 kinase using a luminescent ADP detection assay. Reactions were carried out at 5 µM ATP. The assays were done in duplicate and data represent the mean ± SD of mean. Curve fitting was performed using GraphPad Prism sigmoidal dose-response (variable slope) software.
Fig. 7
Fig. 7. Kinetics of VSV replication, MxA expression and apoptosis induction in HPAF-II cells treated with TPCA-1, ruxolitinib or JAK Inh. I
Cells were infected with VSV-ΔM51-GFP at cell specific MOI 0.01 for 1 h, then treated with TPCA-1 (8 µM), ruxolitinib (2.5 µM) or JAK Inh. I (2.5 µM) immediately after virus removal. Treatment was maintained until the end of the experiment. Cells were harvested at each time point and lysates were prepared and analyzed by western blot for the indicated protein.
Fig. 8
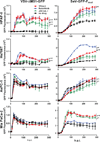
Fig. 8. TPCA-1, ruxolitinib and JAK Inh. I enhance replication of SeV
Cells were infected with VSV-ΔM51-GFP or SeV-GFP-Fmut at MOI 1 (based on BHK-21 cells), and treated with TPCA-1 (8 µM), ruxolitinib (2.5 µM) or JAK Inh. I (2.5 µM). Cell-specific MOIs are MOI 0.00068 based on HPAF-II, MOI0.0018based on Hs766T, MOI 0.024 based on AsPC-1 and MOI 0.066 based on Mia PaCa-2. GFP fluorescence was measured and background fluorescence from uninfected treated cells was subtracted at each time point p.i. The assays were done in triplicate and data represent the mean ± SD of mean. Statistical significances (p < 0.05) between treatment (T: TPCA-1, R: ruxolitinib, J: JAK Inh. I) and no treated cells (no drug) at 72 h (*) and 148 h (#) are indicated.

Similar articles

Cited by

References

    1. Ahmed M, McKenzie MO, Puckett S, Hojnacki M, Poliquin L, Lyles DS. Ability of the matrix protein of vesicular stomatitis virus to suppress beta interferon gene expression is genetically correlated with the inhibition of host RNA and protein synthesis. J. Virol. 2003;77:4646–4657. - PMC - PubMed
    1. Barber GN. VSV-tumor selective replication and protein translation. Oncogene. 2005;24:7710–7719. - PubMed
    1. Basagoudanavar SH, Thapa RJ, Nogusa S, Wang J, Beg AA, Balachandran S. Distinct roles for the NF-kappa B RelA subunit during antiviral innate immune responses. J. Virol. 2011;85:2599–2610. - PMC - PubMed
    1. Basseres DS, Baldwin AS. Nuclear factor-kappaB and inhibitor of kappaB kinase pathways in oncogenic initiation and progression. Oncogene. 2006;25:6817–6830. - PubMed
    1. Bi Z, Barna M, Komatsu T, Reiss CS. Vesicular stomatitis virus infection of the central nervous system activates both innate and acquired immunity. J. Virol. 1995;69:6466–6472. - PMC - PubMed

Publication types

MeSH terms