. 2015 Sep 15;112(37):11559-64.
doi: 10.1073/pnas.1507703112. Epub 2015 Aug 31.

Roles of helix H69 of 23S rRNA in translation initiation

Affiliations

Roles of helix H69 of 23S rRNA in translation initiation

Qi Liu et al. Proc Natl Acad Sci U S A. .

Abstract

Initiation of translation involves the assembly of a ribosome complex with initiator tRNA bound to the peptidyl site and paired to the start codon of the mRNA. In bacteria, this process is kinetically controlled by three initiation factors--IF1, IF2, and IF3. Here, we show that deletion of helix H69 (∆H69) of 23S rRNA allows rapid 50S docking without concomitant IF3 release and virtually eliminates the dependence of subunit joining on start codon identity. Despite this, overall accuracy of start codon selection, based on rates of formation of elongation-competent 70S ribosomes, is largely uncompromised in the absence of H69. Thus, the fidelity function of IF3 stems primarily from its interplay with initiator tRNA rather than its anti-subunit association activity. While retaining fidelity, ∆H69 ribosomes exhibit much slower rates of overall initiation, due to the delay in IF3 release and impedance of an IF3-independent step, presumably initiator tRNA positioning. These findings clarify the roles of H69 and IF3 in the mechanism of translation initiation and explain the dominant lethal phenotype of the ∆H69 mutation.

Keywords: IF2; IF3; fMet-tRNA; ribosome; start codon selection.


Conflict of interest statement

The authors declare no conflict of interest.

Figures

Fig. 1.
Fig. 1.
Location and structure of H69 in the ribosome. (A) Secondary structure of H69 and its location in the 23S rRNA [schematic diagram adapted from the Comparative RNA Website (35)]. Nucleotides making contact with P-site tRNA are highlighted in orange, regions predicted to interact with IF2 are marked with a pink line, and regions predicted to clash with IF3 are indicated by a dashed purple line. (B) Tertiary structure of H69 in the 70S ribosome [based on Protein Data Bank ID codes 2WDG and 2WDI (20)]. Atoms involved in interactions between H69 and P-site tRNA or helix h44 of 16S rRNA are shown in spheres. (C) Nucleotides replacing the native sequence (nt 1906–1930) in ΔH69, ΔLoop, and ΔLoop+4 mutants.
Fig. 2.
Fig. 2.
H69 is important for IF3 regulation of subunit joining. (A and B) Apparent rates of 50S docking were measured by mixing preassembled 30SIC with WT (AUC, blue; AUG, red) or ΔH69 (AUC, green; AUG, black) 50S subunits, in the presence (A) or absence (B) of IF3. Data were fit to a double-exponential equation to obtain apparent rates shown in Table 1. AU, arbitrary units. (C) Apparent rates of 50S docking were plotted against IF3 concentration for WT (red circles) and ΔH69 (blue squares) ribosomes. Data were fitted to the modified dose–response equation kapp = kmax/[1 + (IF3)/IC50] to obtain IC50 values. WT, IC50 = 0.17 μM; ΔH69, IC50 = 0.87 μM.
Fig. S1.
Fig. S1.
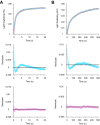
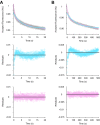
Examples of data fitting in LS experiments. Shown are collected LS data (gray) in the presence of AUG (A) or AUC (B), fitted to single- (blue trace) or double- (pink trace) exponential equations, using the program KaleidaGraph (Top panels). Corresponding residual plots for the single- (blue) and double- (pink) exponential fits are shown in the Middle and Bottom panels, respectively. Based on residual plots, two exponential terms are necessary for reasonable fits to the experimental data.
Fig. S2.
Fig. S2.
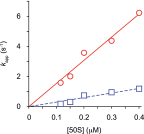
Dependence of apparent rates of subunit joining on 50S concentration. Shown are apparent rates for the fast (red circles) and slow (blue squares) phases of WT 50S docking plotted versus 50S concentration. Data were fit to a linear equation (lines), yielding slopes of 15.4 and 3.0, respectively.
Fig. S3.
Fig. S3.
Effect of IF3 on 50S docking. Apparent rates of 50S docking were measured with WT (A) or ΔH69 (B) 50S subunits, at various concentrations of IF3 (as indicated).
Fig. S4.
Fig. S4.
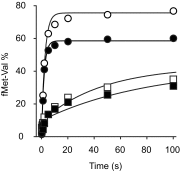
IF3-AF555 and 30S-DY647 are functional in initiation. Apparent rates of dipeptide formation after mixing preassembled dual-labeled (closed symbols) or unlabeled (open symbols) 30SIC with 50S subunits and ternary complex, under identical conditions, in the presence of the AUG (circles) or AUC (squares) start codon. Data were fit to a single-exponential equation to obtain apparent rates. In the presence of IF3-AF555 and 30S-DY647, kapp = 0.53 s−1 for 30SIC(AUG) and kapp = 0.017 s−1 for 30SIC(AUC).
Fig. S5.
Fig. S5.
Characterization of FRET between IF3-AF555 and 30S-DY647. (A) Steady-state fluorescence spectra of 30SIC (0.1 μM) preassembled with only IF3-AF555 (donor, green trace), only 30S-DY647 (acceptor, red trace), or both IF3-AF555 and 30S-DY647 (blue trace) obtained from a Fluorolog-3 spectrometer (HORIBA) using an excitation wavelength of 500 nm. Excess unlabeled IF3 (2 μM) was added to the dual-labeled sample and incubated for 10 min at room temperature, and the spectrum was measured again (orange trace). The FRET efficiency between IF3-AF555 and 30S-DY647, derived from donor emission, was 0.28 ± 0.04 (mean ± SD, n = 3). This value was calculated from the equation E = 1 – IDA/ID, where IDA and ID are the total donor fluorescence intensities in the presence and absence of acceptor, respectively, determined by spectral decomposition using a|e Spectral Software. (B) Fluorescence traces were recorded upon mixing 50S subunits (0.15 μM final) and 30SIC (0.05 μM final) preassembled in the presence of only donor (D, green), only acceptor (A, red), or both fluorophores (D+A, blue) in a stopped-flow spectrometer. Samples were excited at 500 nm, and a 645-nm cutoff filter was placed in front of the fluorescence detector for all experiments. (C) Apparent rates of IF3-30S FRET change were measured by mixing unlabeled IF3 (1 μM final) and dual-labeled 30SIC (0.05 μM final) containing start codon AUG (orange) or AUC (purple) in a stopped-flow spectrometer, using the same setup as in B. Data were fit to a double-exponential equation to obtain apparent rates. For 30SIC(AUG), kapp1 = 40 s−1, A1 = 0.19, and kapp2 = 0.27 s−1, A2 = 0.11. For 30SIC(AUC), kapp1 = 1.1 s−1, A1 = 0.12, and kapp2 = 0.15 s−1, A2 = 0.17.
Fig. 3.
Fig. 3.
Dissociation of IF3 during initiation depends on H69. Apparent rates of (A) IF3-30S or (B) tRNA-IF3 FRET changes were measured by mixing preassembled 30SIC with WT (AUC, blue; AUG, red) or ΔH69 (AUC, green; AUG, black) 50S subunits. Data were fit to a double-exponential equation to obtain apparent rates shown in Table 2. 30S, pale yellow; acceptor fluorophore, red star; donor fluorophore, green star; fMet-tRNAfMet, orange; IF1, dark blue; IF2, pink; IF3, purple; mRNA, brown.
Fig. S6.
Fig. S6.
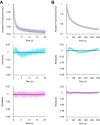
Examples of data fitting in the 30S-IF3 FRET experiments. Acceptor fluorescence (gray) was recorded upon mixing WT 50S subunits to the dual-labeled 30SIC(AUG) (A) or 30SIC(AUC) (B) with an excitation wavelength of 500 nm and a cutoff filter of 645 nm in front of the fluorescence detector. Data were fit to single- (blue trace) or double- (pink trace) exponential equations (Top panels), and the corresponding residual plots are shown in the Middle and Bottom panels, respectively. Based on residual plots, two exponential terms are necessary for reasonable fits to the data.
Fig. S7.
Fig. S7.
Characterization of FRET between tRNA-OG488 and IF3-AF555. (A) Steady-state fluorescence spectra of 30SIC (0.1 μM) preassembled with only tRNA-OG488 (donor, green trace), only IF3-AF555 (acceptor, red trace), or both tRNA-OG488 and IF3-AF555 (blue trace) were measured in a Fluorolog-3 spectrometer (HORIBA) using an excitation wavelength of 460 nm. Excess unlabeled IF3 (2 μM) was added to the dual-labeled sample, incubated for 10 min at room temperature, and the spectrum was measured again (orange trace). The FRET efficiency between tRNA-OG488 and IF3-AF555, derived from donor emission, was 0.14 ± 0.01 (mean ± SD, n = 3). (B) Fluorescence traces were recorded upon mixing 50S subunits (0.15 μM final) and 30SIC (0.05 μM final) preassembled in the presence of only donor (D, green), only acceptor (A, red), or both fluorophores (D+A, blue) in a stopped-flow spectrometer. Samples were excited at 460 nm, and a 590-nm cutoff filter was placed in front of the fluorescence detector for all experiments. (C) Apparent rates of tRNA-IF3 FRET change were measured by mixing unlabeled IF3 (1 μM) and 30SIC (0.05 μM) preassembled with both tRNA-OG488 and IF3-AF555 in the presence of AUG (orange) or AUC (purple) in a stopped-flow spectrometer, using the same setup as in B. Data were fit to a double-exponential equation to obtain apparent rates. For 30SIC(AUG), kapp1 = 28 s−1, A1 = 0.077, and kapp2 = 1.4 s−1, A2 = 0.037. For 30SIC(AUC), kapp1 = 1.1 s−1, A1 = 0.068, and kapp2 = 0.10 s−1, A2 = 0.064.
Fig. S8.
Fig. S8.
Examples of data fitting in the tRNA-IF3 FRET experiments. Acceptor fluorescence (gray) was recorded upon mixing WT 50S subunits to the dual-labeled 30SIC(AUG) (A) or 30SIC(AUC) (B), using an excitation wavelength of 460 nm and a 590-nm cutoff filter. Data were fit to single- (blue trace) or double- (pink trace) exponential equations (Top panels), and the corresponding residual plots are shown in the Middle and Bottom panels, respectively. Based on residual plots, two exponential terms are necessary for reasonable fits to the data.
Fig. 4.
Fig. 4.
Formation of elongation-competent 70SIC depends on H69. (A) Apparent rates of dipeptide formation were measured after mixing preassembled 30SIC with WT (open symbols) or ΔH69 (closed symbols) 50S subunits and ternary complex, in the presence of an AUG (circles) or AUC (squares) start codon. (B) Apparent rates of dipeptide formation were measured by mixing enzymatically preassembled WT (open symbols) or ΔH69 (closed symbols) 70SIC with ternary complex, in the presence (squares) or absence (circles) of IF3. Data were fit to a single-exponential equation to obtain apparent rates shown in Table 3.
Fig. S9.
Fig. S9.
A model for the roles of H69 in 70SIC formation. Docking of the 50S subunit to the 30SIC results in a labile 70SICi containing both IF3 and fMet-tRNAfMet. A steric clash between H69 and IF3 negatively regulates 50S docking. At later steps, H69 triggers IF3 dissociation from the 70SICi and helps positioning of fMet-tRNAfMet into the P/P site, thereby facilitating formation of elongation-competent 70SIC. 30S, pale yellow; 50S, light blue; fMet-tRNAfMet, orange; IF1, dark blue; IF2, pink; IF3, purple; mRNA, brown.

Similar articles

Cited by

References

    1. Milón P, Maracci C, Filonava L, Gualerzi CO, Rodnina MV. Real-time assembly landscape of bacterial 30S translation initiation complex. Nat Struct Mol Biol. 2012;19(6):609–615. - PubMed
    1. Julián P, et al. The cryo-EM structure of a complete 30S translation initiation complex from Escherichia coli. PLoS Biol. 2011;9(7):e1001095. - PMC - PubMed
    1. Carter AP, et al. Crystal structure of an initiation factor bound to the 30S ribosomal subunit. Science. 2001;291(5503):498–501. - PubMed
    1. Simonetti A, et al. Structure of the 30S translation initiation complex. Nature. 2008;455(7211):416–420. - PubMed
    1. Antoun A, Pavlov MY, Lovmar M, Ehrenberg M. How initiation factors maximize the accuracy of tRNA selection in initiation of bacterial protein synthesis. Mol Cell. 2006;23(2):183–193. - PubMed

Publication types

LinkOut - more resources