

The PTTG1-targeting miRNAs miR-329, miR-300, miR-381, and miR-655 inhibit pituitary tumor cell tumorigenesis and are involved in a p53/PTTG1 regulation feedback loop
- PMID: 26320179
- PMCID: PMC4745736
- DOI: 10.18632/oncotarget.5003
The PTTG1-targeting miRNAs miR-329, miR-300, miR-381, and miR-655 inhibit pituitary tumor cell tumorigenesis and are involved in a p53/PTTG1 regulation feedback loop
Abstract
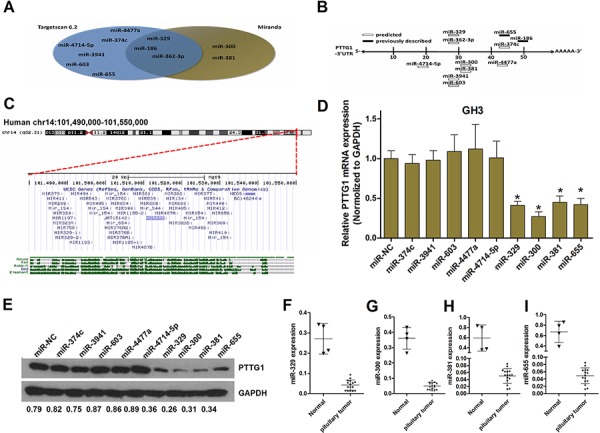
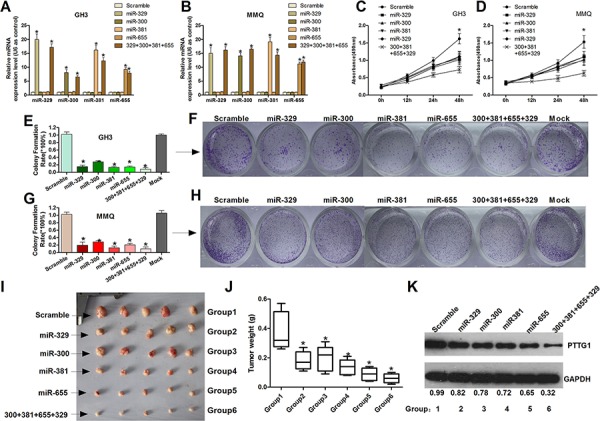
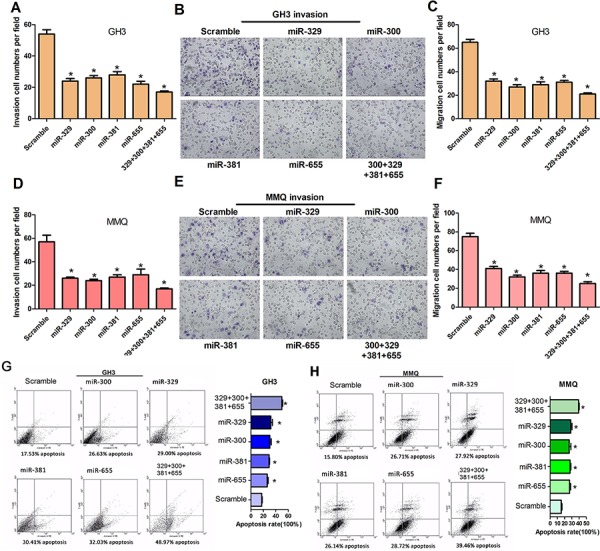
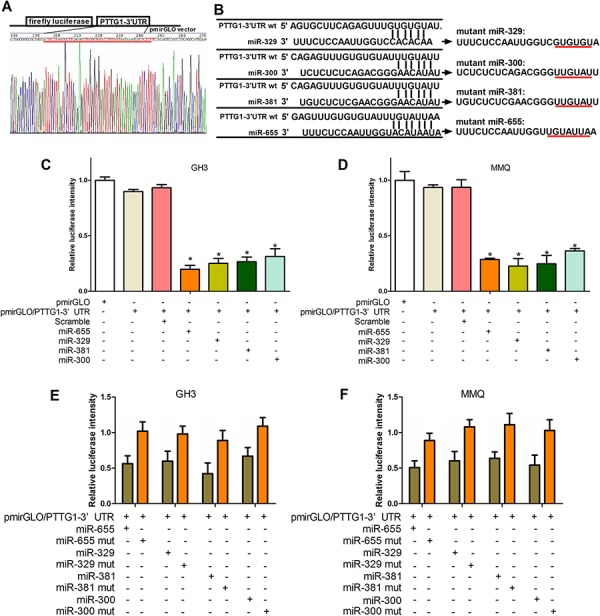
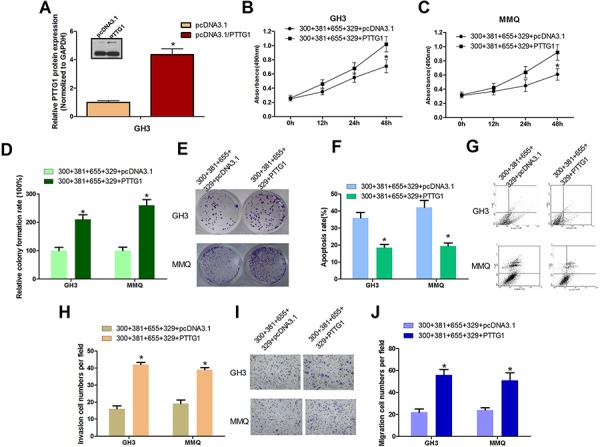
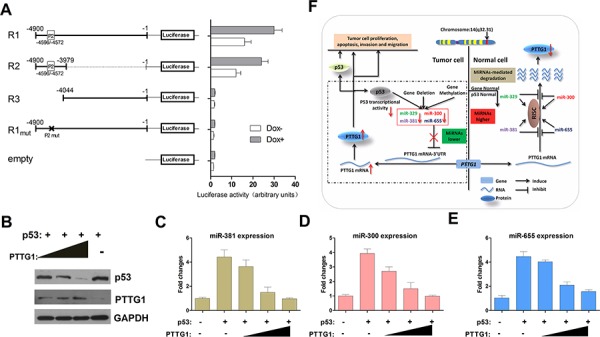
Deregulation of the pituitary tumor transforming gene (PTTG1), a newly discovered oncogene, is a hallmark of various malignancies, including pituitary tumors. However, the mechanisms regulating PTTG1 expression are still needed to be explored. MicroRNAs (miRNAs) are a novel class of small RNA molecules that act as posttranscriptional regulators of gene expression and can play a significant role in tumor development. Here, we identified a series of miRNAs, namely, miR-329, miR-300, miR-381 and miR-655, which could target PTTG1 messenger RNA and inhibit its expression. Interestingly, all four miRNAs significantly that are downregulated in pituitary tumors were mapped to the 14q32.31 locus, which acts as a tumor suppressor in several cancers. Functional studies show that the PTTG1-targeting miRNAs inhibit proliferation, migration and invasion but induce apoptosis in GH3 and MMQ cells. Furthermore, overexpression of a PTTG1 expression vector lacking the 3'UTR partially reverses the tumor suppressive effects of these miRNAs. Next, we identified the promoter region of PTTG1-targeting miRNAs with binding sites for p53. In our hands, p53 transcriptionally activated the expression of these miRNAs in pituitary tumor cells. Finally, we found that PTTG1 could inhibit p53 transcriptional activity to the four miRNAs. These data indicate the existence of a feedback loop between PTTG1 targeting miRNAs, PTTG1 and p53 that promotes pituitary tumorigenesis. Together, these findings suggest that these PTTG1-targeting miRNAs are important players in the regulation of pituitary tumorigenesis and that these miRNAs may serve as valuable therapeutic targets for cancer treatment.
Keywords: PTTG1; miRNAs; p53; pituitary tumor.
Conflict of interest statement
None declare.
Figures

Similar articles
-
PTTG1 regulated by miR-146a-3p promotes bladder cancer migration, invasion, metastasis and growth.Oncotarget. 2017 Jan 3;8(1):664-678. doi: 10.18632/oncotarget.13507. Oncotarget. 2017. PMID: 27893422 Free PMC article.
-
miR-150, p53 protein and relevant miRNAs consist of a regulatory network in NSCLC tumorigenesis.Oncol Rep. 2013 Jul;30(1):492-8. doi: 10.3892/or.2013.2453. Epub 2013 May 13. Oncol Rep. 2013. PMID: 23670238
-
MiR-132, miR-15a and miR-16 synergistically inhibit pituitary tumor cell proliferation, invasion and migration by targeting Sox5.Cancer Lett. 2015 Jan 28;356(2 Pt B):568-78. doi: 10.1016/j.canlet.2014.10.003. Epub 2014 Oct 8. Cancer Lett. 2015. PMID: 25305447
-
MicroRNAs in pituitary tumors.Mol Cell Endocrinol. 2017 Nov 15;456:51-61. doi: 10.1016/j.mce.2017.01.021. Epub 2017 Jan 13. Mol Cell Endocrinol. 2017. PMID: 28089822 Review.
-
The emerging role of miR-506 in cancer.Oncotarget. 2016 Sep 20;7(38):62778-62788. doi: 10.18632/oncotarget.11294. Oncotarget. 2016. PMID: 27542202 Free PMC article. Review.
Cited by
-
Development and validation of a prognostic nomogram for patients with lung adenocarcinoma based on a novel 6-DNA repair-related gene signature.Am J Transl Res. 2021 Apr 15;13(4):1952-1970. eCollection 2021. Am J Transl Res. 2021. PMID: 34017369 Free PMC article.
-
miR-300 regulates cellular radiosensitivity through targeting p53 and apaf1 in human lung cancer cells.Cell Cycle. 2017 Oct 18;16(20):1943-1953. doi: 10.1080/15384101.2017.1367070. Epub 2017 Sep 12. Cell Cycle. 2017. PMID: 28895780 Free PMC article.
-
Alteration of Pituitary Tumor Transforming Gene 1 by MicroRNA-186 and 655 Regulates Invasion Ability of Human Oral Squamous Cell Carcinoma.Int J Mol Sci. 2021 Jan 20;22(3):1021. doi: 10.3390/ijms22031021. Int J Mol Sci. 2021. PMID: 33498448 Free PMC article.
-
The Role of microRNAs in Multidrug Resistance of Glioblastoma.Cancers (Basel). 2022 Jun 30;14(13):3217. doi: 10.3390/cancers14133217. Cancers (Basel). 2022. PMID: 35804989 Free PMC article. Review.
-
MicroRNA-381-A Key Transcriptional Regulator: Its Biological Function and Clinical Application Prospects in Cancer.Front Oncol. 2020 Nov 26;10:535665. doi: 10.3389/fonc.2020.535665. eCollection 2020. Front Oncol. 2020. PMID: 33324542 Free PMC article. Review.
References
-
- Pei L, Melmed S. Isolation and characterization of a pituitary tumor-transforming gene (PTTG) Molecular endocrinology (Baltimore, Md) 1997;11:433–441. - PubMed
-
- Zou H, McGarry TJ, Bernal T, Kirschner MW. Identification of a vertebrate sister-chromatid separation inhibitor involved in transformation and tumorigenesis. Science. 1999;285:418–422. - PubMed
-
- Pei L. Pituitary tumor-transforming gene protein associates with ribosomal protein S10 and a novel human homologue of DnaJ in testicular cells. The Journal of biological chemistry. 1999;274:3151–3158. - PubMed
-
- Filippella M, Galland F, Kujas M, Young J, Faggiano A, Lombardi G, Colao A, Meduri G, Chanson P. Pituitary tumour transforming gene (PTTG) expression correlates with the proliferative activity and recurrence status of pituitary adenomas: a clinical and immunohistochemical study. Clinical endocrinology. 2006;65:536–543. - PubMed
-
- Zhang X, Horwitz GA, Heaney AP, Nakashima M, Prezant TR, Bronstein MD, Melmed S. Pituitary tumor transforming gene (PTTG) expression in pituitary adenomas. The Journal of clinical endocrinology and metabolism. 1999;84:761–767. - PubMed
Publication types
MeSH terms
Substances
LinkOut - more resources
Full Text Sources
Other Literature Sources
Medical
Research Materials
Miscellaneous
