. 2015 Sep 29;6(29):26841-60.
doi: 10.18632/oncotarget.4754.

Resistance to anticancer vaccination effect is controlled by a cancer cell-autonomous phenotype that disrupts immunogenic phagocytic removal

Affiliations

Resistance to anticancer vaccination effect is controlled by a cancer cell-autonomous phenotype that disrupts immunogenic phagocytic removal

Abhishek D Garg et al. Oncotarget. .

Erratum in

Abstract

Immunogenic cell death (ICD) is a well-established instigator of 'anti-cancer vaccination-effect (AVE)'. ICD has shown considerable preclinical promise, yet there remain subset of cancer patients that fail to respond to clinically-applied ICD inducers. Non-responsiveness to ICD inducers could be explained by the existence of cancer cell-autonomous, anti-AVE resistance mechanisms. However such resistance mechanisms remain poorly investigated. In this study, we have characterized for the first time, a naturally-occurring preclinical cancer model (AY27) that exhibits intrinsic anti-AVE resistance despite treatment with ICD inducers like mitoxantrone or hypericin-photodynamic therapy. Further mechanistic analysis revealed that this anti-AVE resistance was associated with a defect in exposing the important 'eat me' danger signal, surface-calreticulin (ecto-CRT/CALR). In an ICD setting, this defective ecto-CRT further correlated with severely reduced phagocytic clearance of AY27 cells as well as the failure of these cells to activate AVE. Defective ecto-CRT in response to ICD induction was a result of low endogenous CRT protein levels (i.e. CRTlow-phenotype) in AY27 cells. Exogenous reconstitution of ecto-rCRT (recombinant-CRT) improved the phagocytic removal of ICD inducer-treated AY27 cells, and importantly, significantly increased their AVE-activating ability. Moreover, we found that a subset of cancer patients of various cancer-types indeed possessed CALRlow or CRTlow-tumours. Remarkably, we found that tumoural CALRhigh-phenotype was predictive of positive clinical responses to therapy with ICD inducers (radiotherapy and paclitaxel) in lung and ovarian cancer patients, respectively. Furthermore, only in the ICD clinical setting, tumoural CALR levels positively correlated with the levels of various phagocytosis-associated genes relevant for phagosome maturation or processing. Thus, we reveal the existence of a cancer cell-autonomous, anti-AVE or anti-ICD resistance mechanism that has profound clinical implications for anticancer immunotherapy and cancer predictive biomarker analysis.

Keywords: calreticulin; immunogenic cell death; patient; predictive biomarker; prognostic biomarker.


Conflict of interest statement

CONFLICTS OF INTEREST

The authors declare that they have no conflict of interest pertaining to this manuscript.

Figures
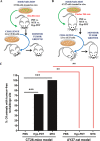
Figure 1
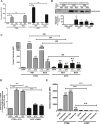
Figure 1. Rat bladder carcinoma AY27 cells exhibit resistance to ‘anticancer vaccination effect’ associated with ICD inducers
CT26 cells A. or AY27 cells B. were treated in vitro with Hyp-PDT (150 nM Hyp incubated for 16 h followed by irradiation with light fluence of 2.70 J/cm2) or mitoxantrone (MTX; 1 μM), followed by recovery at 24 h post-treatment. These treated CT26 and AY27 cells were then injected subcutaneously into BALB/c mice (PBS, n = 10 mice; Hyp-PDT, n = 18 mice; MTX, n = 6 mice) and Fischer 344 rats (PBS, n = 6 rats; Hyp-PDT, n = 6 rats; MTX, n = 6 rats), respectively. Eight to ten days post-vaccination, the mice and rats were challenged in contra-lateral flank with live CT26 (A) and live AY27 (B) cells, respectively. Mice or rats injected with PBS were utilized as placebo-controls. C. This was followed by monitoring of tumour incidence at the challenge site. Statistical analysis was performed using the Fischer's exact test; statistical significance between conditions is indicated by the bars (*p < 0.05, **p < 0.01, ***p < 0.0001).
Figure 2
Figure 2. AY27 cancer cells treated with ICD inducers exhibit disruption in the ability to surface expose CRT and undergo inefficient engulfment by phagocytic cells
CT26 cells or AY27 cells were treated or not (i.e. untreated controls/CNTR) with Hyp-PDT (150 nM Hyp incubated for 16 h followed by irradiation with light fluence of 2.70 J/cm2) or MTX (1 μM). This was followed by – A. analysis of extracellular ATP at indicated time points such that the data is presented as relative light units (RLU) values (n = 3; mean ± s.e.m.; *p < 0.05, **p < 0.01, ***p < 0.0001 as indicated by bars; Student's t-test); B. analysis of extracellularly released HMGB1 in 24 h post-treatment conditioned media via immunoblotting (a graph indicating the mean densitometry intensity of HMGB1 is presented; media-only values have been subtracted; n = 3; mean ± s.d.; *p < 0.05, **p < 0.01, versus respective CNTR; Student's t-test); C. and analysis for surface exposed calreticulin in non-permeabilised cells, performed at indicated time-points, such that the data is presented as mean fluorescence intensity (MFI) (n = 3; mean ± s.d.; *p < 0.05, **p < 0.01, ***p < 0.0001 versus respective CNTR, ###p < 0.0001 as indicated by bars and N.S = non-significant with respect to CNTR; One-way ANOVA with Dunnett's test for comparison with respective CNTR and Bonferroni's test for comparison between other conditions). D. In another case, the phagocytic engulfment of JADE+CT26 and JADE+AY27 cancer cells (recovered 1 h post-treatment) by NIR780+J774 and NIR780+RMW phagocytic cells, respectively, was measured after 4 h of co-incubation. Amount of cancer cells phagocytosed by phagocytes were scored by determining the percentage of double positive events in FACS analysis (i.e. NIR780+/JADE+, representing phagocytosed cancer cells; data is expressed as fold change with respect to/w.r.t. average of respective CNTR; n = 3; mean ± s.e.m.; *p < 0.05, **p < 0.01, ***p < 0.0001 as indicated by the bars; One-way ANOVA with Dunnett's test for comparison with respective CNTR and Bonferroni's test for comparison between other conditions). E. CT26 or AY27 cells were treated or not (i.e. untreated controls/CNTR) with paclitaxel (1 μM), radiotherapy (75 Gy) and topotecan (2 μM) followed by analysis for surface exposed calreticulin in non-permeabilised cells, performed at 12 h post-treatment time-point. Data is presented as mean fluorescence intensity (MFI) (n = 3; mean ± s.e.m.; *p < 0.05, **p < 0.01, ***p < 0.0001 and N.S = non-significant as indicated by bars; One-way ANOVA with Bonferroni's test).
Figure 3
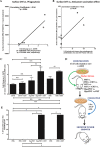
Figure 3. Reconstituting exogenous CRT in AY27 cancer cells, treated with ICD inducers, improves their ability to undergo phagocytosis in vitro and exhibit ‘anticancer vaccination effect’
A correlation analysis was carried out between the amount of surface exposed CRT as evident in Fig. 2C and either in vitro phagocytosis of cancer cells by innate immune cells as evident in Fig. 2D A. or in vivo anticancer vaccination effect as evident in Fig. 1C B. (*p < 0.05 or **p < 0.01; correlation coefficient and p values are mentioned on the graph; Student's t-test). C–E. Rat bladder carcinoma AY27 cells were treated or not (i.e. untreated controls/CNTR) with Hyp-PDT (150 nM Hyp incubated for 16 h followed by irradiation with light fluence of 2.70 J/cm2) or MTX (1 μM). C. Phagocytic engulfment of JADE+AY27 cancer cells (recovered 1 h post-treatment and first incubated, or not, with recombinant CRT (rCRT)) by NIR780+RMW phagocytic cells was measured after 4 h of co-incubation. Amount of cancer cells phagocytosed by phagocytes were scored by determining the percentage of double positive events in FACS analysis (i.e. NIR780+/JADE+, representing phagocytosed cancer cells; data is expressed as fold change with respect to/w.r.t. average of CNTR; n = 3; mean ± s.d.; *p < 0.05, **p < 0.01, ***p < 0.0001 as indicated by the bars; One-way ANOVA with Newman-Keuls test). In another case (D-E), AY27 cells treated in vitro with Hyp-PDT or MTX (as described above), were recovered 24 h post-treatment. These cells were incubated (or not) with rCRT for 30 min, washed and injected subcutaneously into Fischer 344 rats (PBS, n = 5 rats and PBS+rCRT, n = 5 rats; Hyp-PDT n = 6 rats and Hyp-PDT+rCRT, n = 6 rats; MTX, n = 6 rats and MTX+rCRT, n = 6 rats), respectively. Eight to ten days post-vaccination, the rats were rechallenged in contra-lateral flank with live AY27 cells D. Rats injected with PBS or PBS plus rCRT were utilized as placebo-controls (5 rats each). This was followed by monitoring of tumour incidence at the rechallenge site E. Statistical analysis was performed using the Gehan-Breslow-Wilcoxon Test; statistical significance is indicated by the bars (*p < 0.05).
Figure 4
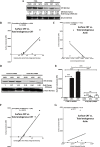
Figure 4. AY27 cancer cells exhibit low endogenous levels of CRT which are associated with a proportionally low surface exposure of CRT in response to ICD inducers
CT26 cells or AY27 cells were treated or not (i.e. untreated controls/CNTR) with Hyp-PDT (150 nM Hyp incubated for 16 h followed by irradiation with light fluence of 2.70 J/cm2) or MTX (1 μM). This was followed by immunoblotting analysis for CRT, 1 h post-treatment A. The calculations based on band densitometry analysis are mentioned as applicable i.e. ratio of endogenous levels of CRT to Actin and the fold-change in this ratio relative to CNTR. Moreover, the bands for CRT and Actin in A for all the conditions were quantified for their integrated density followed by correlation analysis between the amount of surface exposed calreticulin (as evident in Fig. 2C) and endogenous total CRT levels B. or endogenous total Actin levels C. (*p < 0.05; correlation coefficient and p value are mentioned on the graph; Student's t-test). Next, we stably transfected CT26 cancer cells with control-shRNA (CO-shRNA) or shRNA targeting CRT (CRT-shRNA) and the respective clones thus obtained were treated (or not) as described above. This was followed by immunoblotting analysis for CRT, 1 h post-treatment D. The calculations based on band densitometry analysis are mentioned as applicable i.e. fold-change in the ratio of endogenous levels of CRT to Actin, relative to CNTR. Analysis for surface exposed calreticulin in non-permeabilized (treated or untreated) CT26 CO-shRNA or CRT-shRNA cells, was performed at 1 h post-treatment time-point, such that the data is presented as mean fluorescence intensity (MFI) (n = 3; mean ± s.d.; **p < 0.01, ***p < 0.0001 or N.S = non-significant as indicated by bars; One-way ANOVA with Dunnett's test for comparison with respective CNTR and Bonferroni's test for comparison between other conditions). Bands for CRT and Actin in (D) for all the conditions were quantified for their integrated density followed by correlation analysis between the amount of surface exposed calreticulin E. and endogenous CRT levels F. or endogenous Actin levels G. (*p < 0.05; correlation coefficient and p value are mentioned on the graph; Student's t-test).
Figure 5
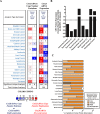
Figure 5. A subset of patients, of various cancer types, show low or reduced overall endogenous levels of CRT/CALR
A. Differential CALR gene copy numbers or CALR mRNA levels between tissues derived from various cancer types and corresponding normal tissues were analysed using the Oncomine database (p-value threshold was set at less than 0.01; all fold changes were deemed valid). Over-expression or under-expression in the top 1, 5 and 10% are color-coded according to the legend. B. Ratio of differential CRT protein levels between tissues derived from various cancer types and corresponding normal tissues were analysed using the dbDEPC 2.0 proteomics database. C. Overall CRT protein levels determined in human tumour tissues via tissue microarray analysis-based immunohistochemistry were retrieved using the Human Protein Atlas database. Here, the level or overall intensity of antibody-based staining has been used to generate three annotated protein expression patterns i.e. high, medium, and low, and no detection levels (colour coded here, in the legend, where the intensity of colour indicates the level of expression/staining).
Figure 6
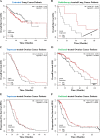
Figure 6. Cancer patients exhibiting low tumoural CALR levels show poor clinical prognosis in response to paclitaxel and radiotherapy
A, B. Lung cancer patients not treated with any therapy (i.e. untreated, n = 227) (A) or treated with radiotherapy only (n = 23) (B) were stratified into high (red lines) or low (black lines) expression-based “risk-groups” by considering the median of the overall transcript-expressions of CALR (untreated – low n = 63, high n = 164; radiotherapy – low n = 15, high n = 8). This was followed by Kaplan-Meier plotting of the patient's overall survival (OS) (Y-axis). C–D. Ovarian cancer patients treated with topotecan only (n = 119) (C) or treated with paclitaxel only (n = 220) (D) were stratified into high (red lines) or low (black lines) expression-based “risk-groups” by considering the median of the overall transcript-expressions of CALR (topotecan – low n = 67, high n = 52; paclitaxel – low n = 69, high n = 151). This was followed by Kaplan-Meier plotting of the patient's OS (Y-axis). E–F. Ovarian cancer patients treated with topotecan only (a = 118) (E) or treated with paclitaxel only (n = 229) (F) were stratified into high (red lines) or low (black lines) expression-based “risk-groups” by considering the median of the overall transcript-expressions of CALR (topotecan – low n = 75, high n = 43; paclitaxel – low n = 57, high n = 172). This was followed by Kaplan-Meier plotting of the patient's progression-free survival (PFS) (Y-axis). In all the above graphs, respective log-rank test p-values and hazard ratios (HR; with its 95% confidence interval in parenthesis) are displayed. Statistical significance (i.e. p < 0.05 or p < 0.001) is indicated through an asterisk (* or **).
Figure 7
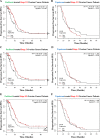
Figure 7. Paclitaxel treated cancer patients with tumoural CALRlow phenotype, show cancer stage-independent poor clinical prognosis
A, B. Stage 2/3 ovarian cancer patients treated with paclitaxel (n = 188) (A) or topotecan (n = 103) (B) were stratified into high (red lines) or low (black lines) expression-based “risk-groups” by considering the median of the overall transcript-expressions of CALR (paclitaxel – low n = 64, high n = 124; topotecan – low n = 25, high n = 78). This was followed by Kaplan-Meier plotting of the patient's progression-free survival (PFS) (Y-axis). C–D. Stage 3 ovarian cancer patients treated with paclitaxel (n = 177) (C) or topotecan (n = 100) (D) were stratified into high (red lines) or low (black lines) expression-based “risk-groups” by considering the median of the overall transcript-expressions of CALR (paclitaxel – low n = 62, high n = 115; topotecan – low n = 66, high n = 34). This was followed by Kaplan-Meier plotting of the patient's PFS (Y-axis). E–F. Stage 3/4 ovarian cancer patients treated with paclitaxel (n = 217) (E) or treated with topotecan (n = 113) (F) were stratified into high (red lines) or low (black lines) expression-based “risk-groups” by considering the median of the overall transcript-expressions of CALR (paclitaxel – low n = 54, high n = 163; topotecan – low n = 73, high n = 40). This was followed by Kaplan-Meier plotting of the patient's PFS (Y-axis). In all the above graphs, respective log-rank test p-values and hazard ratios (HR; with its 95% confidence interval in parenthesis) are displayed. Statistical significance (i.e. p < 0.05 or p < 0.0001) is indicated through an asterisk (* or ***).
Figure 8
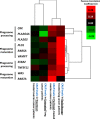
Figure 8. Overall tumoural CALR levels positively correlate with expression levels of phagocytosis-related genes only in cancer patients treated with ICD-inducing therapies
Generation of gene co-expression profiles was accomplished by correlating the expression profiles of phagocytosis-related genes (CRK, PLA2G4A, PLA2G5, PLD1, RAB5A, VAMP7, STAB2, TNFSF11, WAS, RAB7A) with CALR expression levels for the respective scenarios indicated in the Fig. and Pearson's correlation coefficient (r) was used for indicating tendency to co-express. Thereafter the correlation profiles were clustered and represented through a heat map. The colour code is represented as legend.
Figure 9
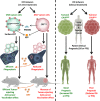
Figure 9. Overall endogenous CRT levels within cancer/tumoural cells dictate the in vivo anti-cancer vaccination effect and clinical efficacy of ICD-inducing anticancer therapies
Cancer cells possessing normal or high CRT levels (e.g. CT26), when treated with ICD inducing therapies, undergo efficient phagocytosis by phagocytes and activate potent anti-cancer vaccination effect (AVE). On the other hand, cancer cells possessing low CRT levels (e.g. AY27), when treated with ICD inducing therapies, undergo inefficient phagocytosis by phagocytes and are incapable of activating AVE. However, exogenous “reconstitution” of ecto-CRT through addition of recombinant-CRT (rCRT) increases the efficiency of phagocytic clearance and increases AVE-activating capacity of the latter cancer cells. In a similar manner, lung or ovarian cancer patients treated with ICD inducers (like radiotherapy or paclitaxel) and having CALRhigh tumours, tend to exhibit good clinical prognosis. On the contrary, lung or ovarian cancer patients treated with ICD inducers and having CALRlow tumours, tend to exhibit poor clinical prognosis. ATP – adenosine triphosphate, CALR – calreticulin mRNA/transcript, CRT – calreticulin protein, HMGB1 – high mobility group box 1, OS – overall survival, PFS – progression-free survival.

Similar articles

Cited by

References

    1. Galluzzi L, Vacchelli E, Bravo-San Pedro JM, Buque A, Senovilla L, Baracco EE, Bloy N, Castoldi F, Abastado JP, Agostinis P, Apte RN, Aranda F, Ayyoub M, Beckhove P, Blay JY, Bracci L, et al. Classification of current anticancer immunotherapies. Oncotarget. 2014;5:12472–12508. - PMC - PubMed
    1. Palucka K, Banchereau J. Dendritic-cell-based therapeutic cancer vaccines. Immunity. 2013;39:38–48. - PMC - PubMed
    1. Adkins I, Fucikova J, Garg AD, Agostinis P, Spisek R. Physical modalities inducing immunogenic tumor cell death for cancer immunotherapy. Oncoimmunology. 2014;3:e968434. - PMC - PubMed
    1. Krysko DV, Garg AD, Kaczmarek A, Krysko O, Agostinis P, Vandenabeele P. Immunogenic cell death and DAMPs in cancer therapy. Nat Rev Cancer. 2012;12:860–875. - PubMed
    1. Chiang CL, Benencia F, Coukos G. Whole tumor antigen vaccines. Semin Immunol. 2010;22:132–143. - PMC - PubMed

Publication types

MeSH terms