

Loss of endogenous Nfatc1 reduces the rate of DMBA/TPA-induced skin tumorigenesis
- PMID: 26310443
- PMCID: PMC4603931
- DOI: 10.1091/mbc.E15-05-0282
Loss of endogenous Nfatc1 reduces the rate of DMBA/TPA-induced skin tumorigenesis
Abstract
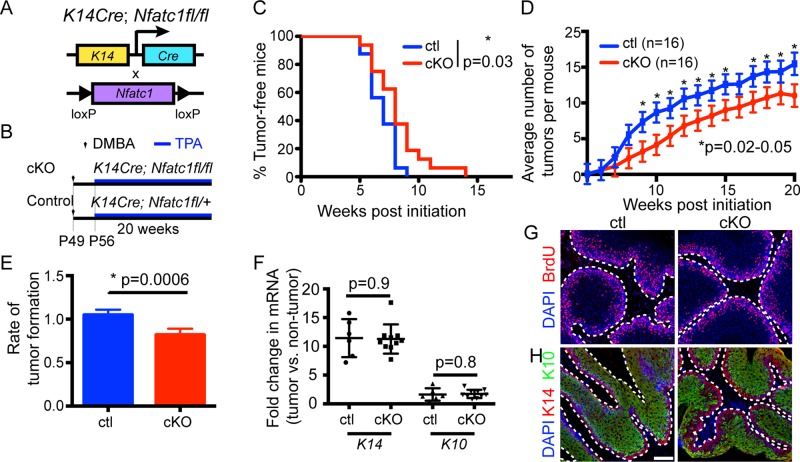
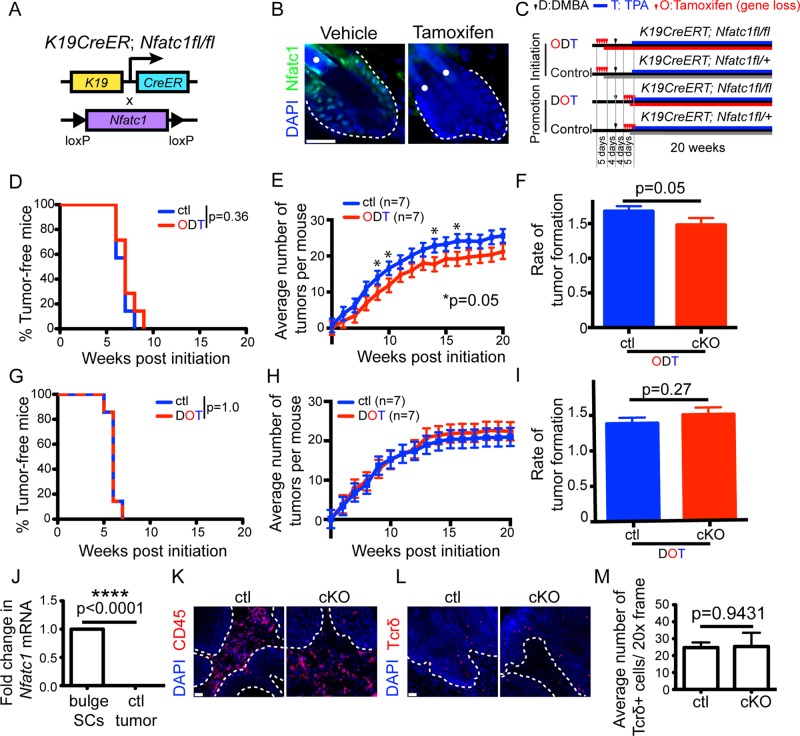
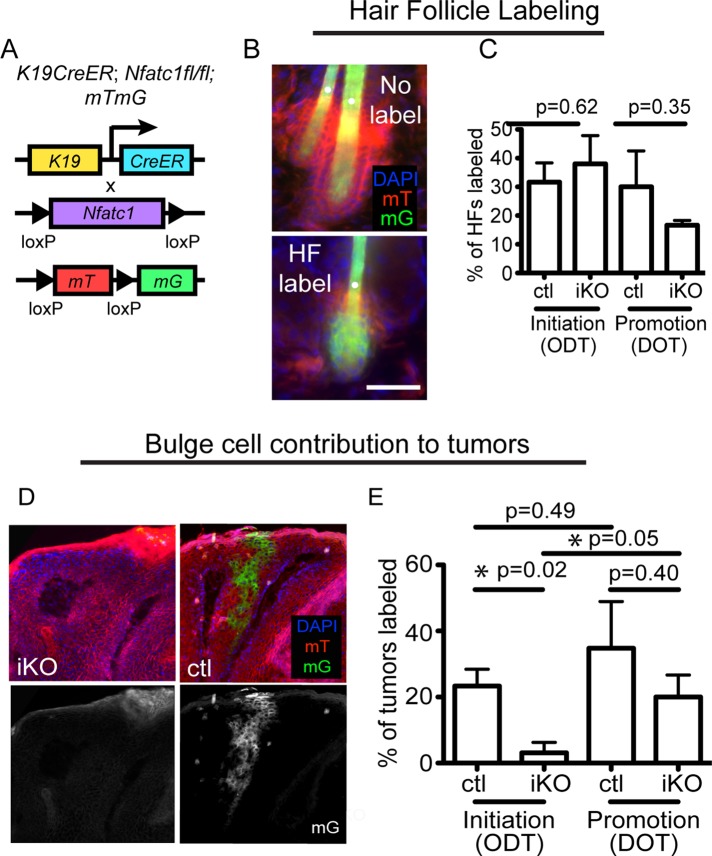
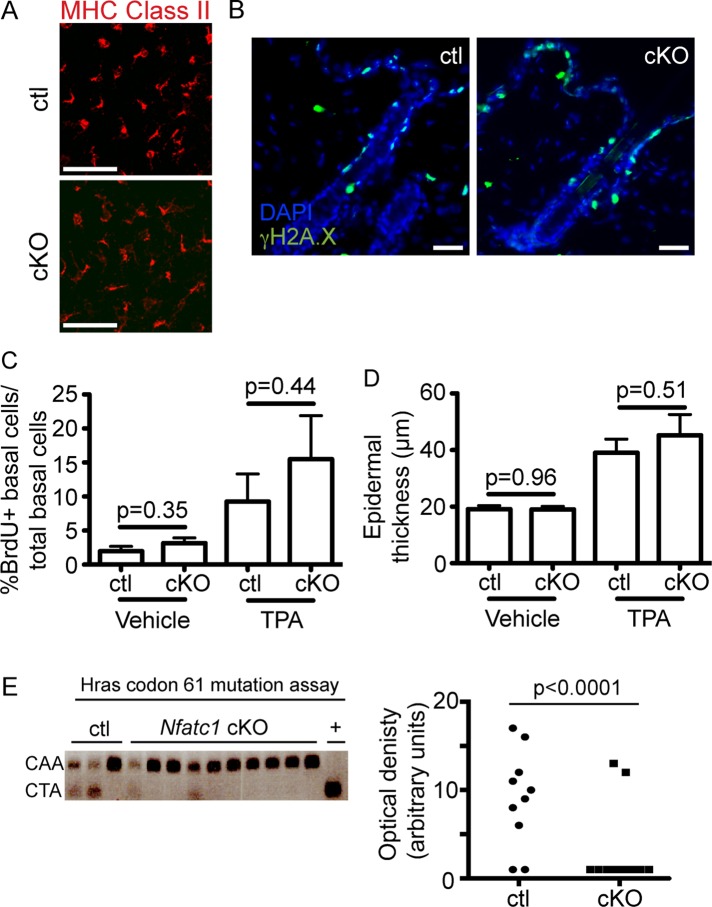
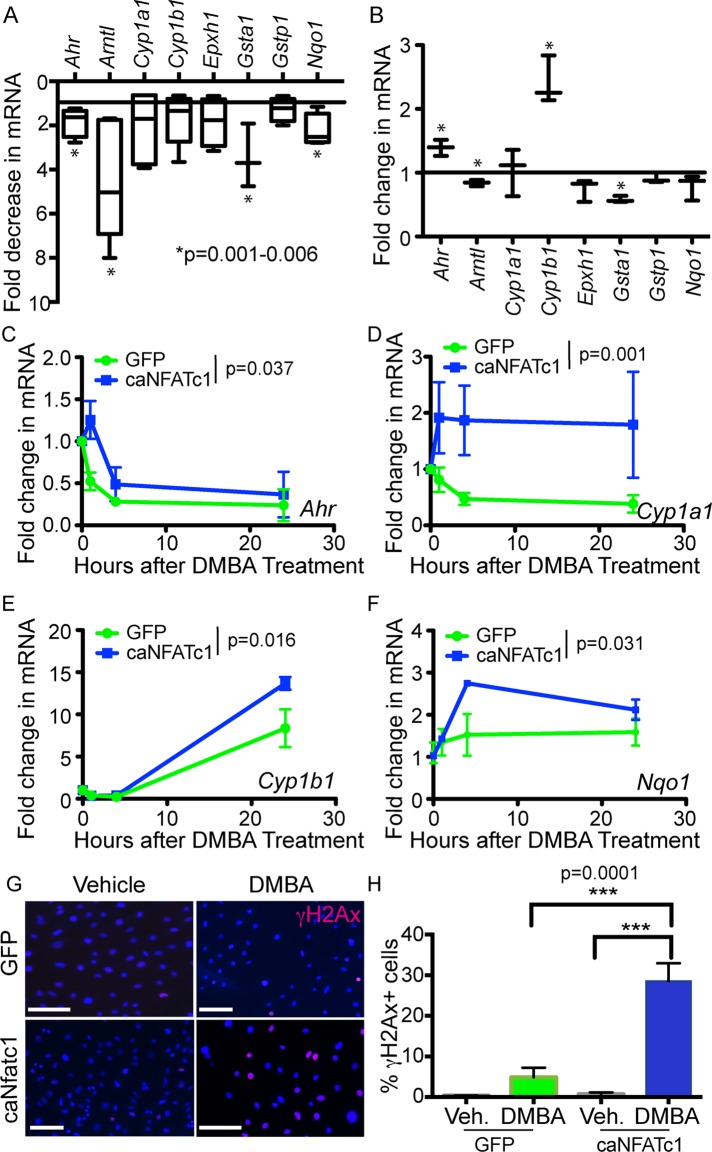
Immunosuppressive therapies using calcineurin inhibitors, such as cyclosporine A, are associated with a higher incidence of squamous cell carcinoma formation in mice and humans. Calcineurin is believed to suppress tumorigenesis in part through Nfatc1, a transcription factor expressed primarily in hair follicle bulge stem cells in mice. However, mice overexpressing a constitutively active Nfatc1 isoform in the skin epithelium developed increased spontaneous skin squamous cell carcinomas. Because follicular stem cells can contribute to skin tumorigenesis, whether the endogenous expression of Nfatc1 inhibits or enhances skin tumorigenesis is unclear. Here we show that loss of the endogenous expression of Nfatc1 suppresses the rate of DMBA/TPA-induced skin tumorigenesis. Inducible deletion of Nfatc1 in follicular stem cells before tumor initiation significantly reduces the rate of tumorigenesis and the contribution of follicular stem cells to skin tumors. We find that skin tumors from mice lacking Nfatc1 display reduced Hras codon 61 mutations. Furthermore, Nfatc1 enhances the expression of genes involved in DMBA metabolism and increases DMBA-induced DNA damage in keratinocytes. Together these data implicate Nfatc1 in the regulation of skin stem cell-initiated tumorigenesis via the regulation of DMBA metabolism.
© 2015 Goldstein et al. This article is distributed by The American Society for Cell Biology under license from the author(s). Two months after publication it is available to the public under an Attribution–Noncommercial–Share Alike 3.0 Unported Creative Commons License (http://creativecommons.org/licenses/by-nc-sa/3.0).
Figures
Similar articles
-
JWA deficiency suppresses dimethylbenz[a]anthracene-phorbol ester induced skin papillomas via inactivation of MAPK pathway in mice.PLoS One. 2012;7(3):e34154. doi: 10.1371/journal.pone.0034154. Epub 2012 Mar 26. PLoS One. 2012. PMID: 22461904 Free PMC article.
-
Meis1 regulates epidermal stem cells and is required for skin tumorigenesis.PLoS One. 2014 Jul 11;9(7):e102111. doi: 10.1371/journal.pone.0102111. eCollection 2014. PLoS One. 2014. PMID: 25013928 Free PMC article.
-
CD34 expression by hair follicle stem cells is required for skin tumor development in mice.Cancer Res. 2007 May 1;67(9):4173-81. doi: 10.1158/0008-5472.CAN-06-3128. Cancer Res. 2007. PMID: 17483328 Free PMC article.
-
Non-melanoma skin cancer in mouse and man.Arch Toxicol. 2013 May;87(5):783-98. doi: 10.1007/s00204-012-0998-9. Epub 2012 Dec 25. Arch Toxicol. 2013. PMID: 23266722 Review.
-
Upregulation of E2F transcription factors in chemically induced mouse skin tumors.Int J Oncol. 1999 Aug;15(2):387-90. doi: 10.3892/ijo.15.2.387. Int J Oncol. 1999. PMID: 10402252 Review.
Cited by
-
Pseudomonas aeruginosa-mannose-sensitive hemagglutinin inhibits chemical-induced skin cancer through suppressing hedgehog signaling.Exp Biol Med (Maywood). 2020 Feb;245(3):213-220. doi: 10.1177/1535370219897240. Epub 2020 Jan 5. Exp Biol Med (Maywood). 2020. PMID: 31903775 Free PMC article.
-
Phenformin Promotes Keratinocyte Differentiation via the Calcineurin/NFAT Pathway.J Invest Dermatol. 2021 Jan;141(1):152-163. doi: 10.1016/j.jid.2020.05.114. Epub 2020 Jun 30. J Invest Dermatol. 2021. PMID: 32619504 Free PMC article.
-
Anti-Cancer and Medicinal Potentials of Moringa Isothiocyanate.Molecules. 2021 Dec 11;26(24):7512. doi: 10.3390/molecules26247512. Molecules. 2021. PMID: 34946594 Free PMC article. Review.
-
Salidroside prevents skin carcinogenesis induced by DMBA/TPA in a mouse model through suppression of inflammation and promotion of apoptosis.Oncol Rep. 2018 Jun;39(6):2513-2526. doi: 10.3892/or.2018.6381. Epub 2018 Apr 18. Oncol Rep. 2018. PMID: 29693192 Free PMC article.
-
Integrin α3β1 in hair bulge stem cells modulates CCN2 expression and promotes skin tumorigenesis.Life Sci Alliance. 2020 May 18;3(7):e202000645. doi: 10.26508/lsa.202000645. Print 2020 Jul. Life Sci Alliance. 2020. PMID: 32423907 Free PMC article.
References
-
- Balmain A, Ramsden M, Bowden GT, Smith J. Activation of the mouse cellular Harvey-ras gene in chemically induced benign skin papillomas. Nature. 1984;307:658–660. - PubMed
-
- Barker N, Ridgway RA, van Es JH, van de Wetering M, Begthel H, van den Born M, Danenberg E, Clarke AR, Sansom OJ, Clevers H. Crypt stem cells as the cells-of-origin of intestinal cancer. Nature. 2009;457:608–611. - PubMed
-
- Blanpain C, Lowry WE, Geoghegan A, Polak L, Fuchs E. Self-renewal, multipotency, and the existence of two cell populations within an epithelial stem cell niche. Cell. 2004;118:635–648. - PubMed
Publication types
MeSH terms
Substances
Grants and funding
LinkOut - more resources
Full Text Sources
Medical
Molecular Biology Databases
Research Materials
Miscellaneous
