Serial femtosecond crystallography of soluble proteins in lipidic cubic phase
- PMID: 26306196
- PMCID: PMC4547822
- DOI: 10.1107/S2052252515013160
Serial femtosecond crystallography of soluble proteins in lipidic cubic phase
Abstract
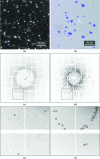
Serial femtosecond crystallography (SFX) at X-ray free-electron lasers (XFELs) enables high-resolution protein structure determination using micrometre-sized crystals at room temperature with minimal effects from radiation damage. SFX requires a steady supply of microcrystals intersecting the XFEL beam at random orientations. An LCP-SFX method has recently been introduced in which microcrystals of membrane proteins are grown and delivered for SFX data collection inside a gel-like membrane-mimetic matrix, known as lipidic cubic phase (LCP), using a special LCP microextrusion injector. Here, it is demonstrated that LCP can also be used as a suitable carrier medium for microcrystals of soluble proteins, enabling a dramatic reduction in the amount of crystallized protein required for data collection compared with crystals delivered by liquid injectors. High-quality LCP-SFX data sets were collected for two soluble proteins, lysozyme and phycocyanin, using less than 0.1 mg of each protein.
Keywords: X-ray free-electron laser; lipidic cubic phase; serial femtosecond crystallography; soluble protein.
Figures


Similar articles
-
Preparation and Delivery of Protein Microcrystals in Lipidic Cubic Phase for Serial Femtosecond Crystallography.J Vis Exp. 2016 Sep 20;(115):54463. doi: 10.3791/54463. J Vis Exp. 2016. PMID: 27683972 Free PMC article.
-
Preparation of microcrystals in lipidic cubic phase for serial femtosecond crystallography.Nat Protoc. 2014 Sep;9(9):2123-34. doi: 10.1038/nprot.2014.141. Epub 2014 Aug 14. Nat Protoc. 2014. PMID: 25122522 Free PMC article.
-
Femtosecond crystallography of membrane proteins in the lipidic cubic phase.Philos Trans R Soc Lond B Biol Sci. 2014 Jul 17;369(1647):20130314. doi: 10.1098/rstb.2013.0314. Philos Trans R Soc Lond B Biol Sci. 2014. PMID: 24914147 Free PMC article. Review.
-
Serial millisecond crystallography of membrane and soluble protein microcrystals using synchrotron radiation.IUCrJ. 2017 May 24;4(Pt 4):439-454. doi: 10.1107/S205225251700570X. eCollection 2017 Jul 1. IUCrJ. 2017. PMID: 28875031 Free PMC article.
-
An outlook on using serial femtosecond crystallography in drug discovery.Expert Opin Drug Discov. 2019 Sep;14(9):933-945. doi: 10.1080/17460441.2019.1626822. Epub 2019 Jun 11. Expert Opin Drug Discov. 2019. PMID: 31184514 Free PMC article. Review.
Cited by
-
Fixed-target serial crystallography at the Structural Biology Center.J Synchrotron Radiat. 2022 Sep 1;29(Pt 5):1141-1151. doi: 10.1107/S1600577522007895. Epub 2022 Aug 17. J Synchrotron Radiat. 2022. PMID: 36073872 Free PMC article.
-
High-speed fixed-target serial virus crystallography.Nat Methods. 2017 Aug;14(8):805-810. doi: 10.1038/nmeth.4335. Epub 2017 Jun 19. Nat Methods. 2017. PMID: 28628129 Free PMC article.
-
All polymer microfluidic chips-A fixed target sample delivery workhorse for serial crystallography.Biomicrofluidics. 2023 Oct 13;17(5):051302. doi: 10.1063/5.0167164. eCollection 2023 Sep. Biomicrofluidics. 2023. PMID: 37840537 Free PMC article.
-
Sample Delivery Media for Serial Crystallography.Int J Mol Sci. 2019 Mar 4;20(5):1094. doi: 10.3390/ijms20051094. Int J Mol Sci. 2019. PMID: 30836596 Free PMC article. Review.
-
Preparation and Delivery of Protein Microcrystals in Lipidic Cubic Phase for Serial Femtosecond Crystallography.J Vis Exp. 2016 Sep 20;(115):54463. doi: 10.3791/54463. J Vis Exp. 2016. PMID: 27683972 Free PMC article.
References
-
- Boutet, S. & Williams, G. J. (2010). New J. Phys. 12, 035024.
-
- Boutet, S. et al. (2012). Science, 337, 362–364. - PubMed
Grants and funding
LinkOut - more resources
Full Text Sources

