. 2015 Sep 8;112(36):E5078-87.
doi: 10.1073/pnas.1514486112. Epub 2015 Aug 24.

Synapse-specific IL-1 receptor subunit reconfiguration augments vulnerability to IL-1β in the aged hippocampus

Affiliations

Synapse-specific IL-1 receptor subunit reconfiguration augments vulnerability to IL-1β in the aged hippocampus

G Aleph Prieto et al. Proc Natl Acad Sci U S A. .

Abstract

In the aged brain, synaptic plasticity and memory show increased vulnerability to impairment by the inflammatory cytokine interleukin 1β (IL-1β). In this study, we evaluated the possibility that synapses may directly undergo maladaptive changes with age that augment sensitivity to IL-1β impairment. In hippocampal neuronal cultures, IL-1β increased the expression of the IL-1 receptor type 1 and the accessory coreceptor AcP (proinflammatory), but not of the AcPb (prosurvival) subunit, a reconfiguration that potentiates the responsiveness of neurons to IL-1β. To evaluate whether synapses develop a similar heightened sensitivity to IL-1β with age, we used an assay to track long-term potentiation (LTP) in synaptosomes. We found that IL-1β impairs LTP directly at the synapse and that sensitivity to IL-1β is augmented in aged hippocampal synapses. The increased synaptic sensitivity to IL-1β was due to IL-1 receptor subunit reconfiguration, characterized by a shift in the AcP/AcPb ratio, paralleling our culture data. We suggest that the age-related increase in brain IL-1β levels drives a shift in IL-1 receptor configuration, thus heightening the sensitivity to IL-1β. Accordingly, selective blocking of AcP-dependent signaling with Toll-IL-1 receptor domain peptidomimetics prevented IL-1β-mediated LTP suppression and blocked the memory impairment induced in aged mice by peripheral immune challenge (bacterial lipopolysaccharide). Overall, this study demonstrates that increased AcP signaling, specifically at the synapse, underlies the augmented vulnerability to cognitive impairment by IL-1β that occurs with age.

Keywords: AcP; AcPb; LTP; neuroinflammation; receptor sensitivity.


Conflict of interest statement

The authors declare no conflict of interest.

Figures
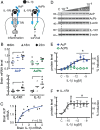
Fig. 1.
Fig. 1.
Aging and IL-1β reconfigure the IL-1 receptor system. (A) Neuronal IL-1 receptor system. Note that AcPb has a long C-terminal region potentially blocking MyD88 recruitment (see text). (B) Whole-brain mRNA expression of AcP, AcPb, IL-1R1, and IL-1β in mice at 6 (n = 5), 18 (n = 3), and 23 (n = 5) mo old, determined by qPCR. Levels were normalized with values from 6-mo-old mice and are presented in dot plots (mean indicated by a bar). GAPDH level was used as internal control. *P < 0.05 (Kruskal–Wallis, Dunn’s post hoc test). (C) Correlation between AcP and IL-1β relative expression in the whole set of brain samples (r2 = 0.78; n = 13). (D) Western blot analysis of AcP, AcPb, and IL-1R1 in primary rat hippocampal neurons (5–7 DIV) treated with IL-1β (3 h, 0.3 fM to 3 nM, in 10-fold increments). β-actin was used as loading control. (E and F) AcP, AcPb (E; n = 5), and IL-1R1 (F; n = 4) densitometry values were normalized to vehicle-treated cells (c, control); results are from five independent experiments (neurons from different embryo litters). AcP vs. AcPb, P < 0.0001 (two-way ANOVA main effect of receptor, F1,54 = 46.1); *P < 0.01 (Bonferroni post hoc test). IL-1R1 vs. AcPb, P < 0.0001 (two-way ANOVA main effect of receptor, F1,51 = 46.8); #P < 0.05 (Bonferroni post hoc test). Concentration–response relationships were fitted to the Hill equation (black traces), and the highest induction of AcP (E) and IL-1R1 (F) was set as the Emax (maximal effect, 100%). Data are presented as mean ± SEM.
Fig. S1.
Fig. S1.
AcP induction by IL-1β is time- and concentration-dependent. (A) CNS-restricted expression of AcPb. AcP (∼62 KDa) and AcPb (∼80 KDa) detection by Western blot (full-length blot) is shown. Unidentified proteins (arrowheads) were detected in heart and liver. (B) AcP and AcPb by Western blotting in cultured hippocampal neurons (5–7 DIV) treated with 3 nM IL-1β for the indicated times; β-actin served as loading control. AcP and AcPb densitometry values were quantified at each time point and normalized to vehicle-treated cells (time = 0). *P < 0.05 [AcP vs. control; ANOVA, Tukey’s post hoc test; n = 6 per group; six independent experiments (neurons from different embryo litters)]. (C and D) mRNA levels in neurons treated with IL-1β (3 fM to 3 nM; 100-fold increase) for 3 h; shown are AcP (C; n = 7), AcPb (C; n = 5), and IL-1R1 (D; n = 7), with results from seven independent experiments. Values were normalized to vehicle-treated cells (dotted line), and GAPDH was used as internal control. *P < 0.05 (AcP vs. control); (*)P < 0.01 (IL-1R1 vs. control) (Kruskal–Wallis, Dunn post hoc test). Data are presented as mean ± SEM.
Fig. 2.
Fig. 2.
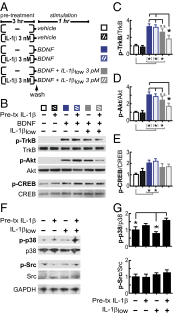
IL-1β pretreatment sensitizes the inflammatory branch of IL-1β signaling in rat hippocampal neurons. (A) Experimental design: Primary rat hippocampal neurons (5–7 DIV) were preincubated with 3 nM IL-1β or vehicle for 3 h, washed, and stimulated with BDNF with or without IL-1βlow for 1 h, as indicated. (B) Western blot analysis of phosphorylated and total levels of TrkB, Akt, and CREB after the above treatments. (CE) Relative levels of p-TrkB (Tyr-490)/TrkB (C), p-Akt (Ser-473)/Akt (D), and p-CREB (Ser-133)/CREB (E). Data were normalized with vehicle-treated neurons (control) (n = 9; nine independent experiments). *P < 0.05; (*)P < 0.01; [*]P < 0.001; n.s., not significant (ANOVA, Tukey’s post hoc test). (F and G) Primary rat hippocampal neurons (5–7 DIV) were preincubated with 3 nM IL-1β or vehicle for 3 h, washed, and stimulated with IL-1βlow for 20 min, as indicated. Western blot analysis of phosphorylated and total levels of p38 and Src followed the above treatments. (G) Relative levels of p-p38 (Thr-180/Tyr-182)/p38 and p-Src (Tyr-416)/Src. Data were normalized with vehicle-treated neurons (control) (n = 8; eight independent experiments). *P < 0.05; (*)P < 0.01 (ANOVA, Tukey’s post hoc test). Data are presented as mean ± SEM.
Fig. S2.
Fig. S2.
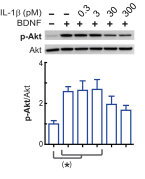
Inhibition of BDNF signaling by IL-1β is dose-dependent. Primary rat hippocampal neurons (5–7 DIV) were incubated with IL-1β (0.3, 3, 30, or 300 pM) or vehicle for 1 h and stimulated with BDNF (50 ng/mL) for an additional 1 h. Phosphorylated and total levels of Akt were assessed. Relative levels of p-Akt(Ser-473)/Akt were calculated, normalizing to p-Akt/Akt levels from vehicle-treated neurons (control) [n = 5 per group; five independent experiments (neurons from different embryo litters)]. (*)P < 0.01 (ANOVA, Tukey’s post hoc test). Data are presented as mean ± SEM.
Fig. S3.
Fig. S3.
IL-1βlow sensitizes its own response via IL-1R1. (A) Experimental design: Primary hippocampal neurons at 5–7 DIV were preincubated with IL-1βlow (3 pM) or vehicle for 3 h. After washing, vehicle-treated neurons were stimulated with vehicle or BDNF only (50 ng/mL, 1 h), whereas neurons pretreated (pre-Tx) with IL-1βlow were stimulated with BDNF in the presence of IL-1βlow for 1 h. To specifically test the role of IL-1R1 on the induction of sensitivity, IL-1ra (300 nM) was added 30 min before IL-1βlow pretreatment, but was absent during stimulation. Control groups consisted of a vehicle-only group (vehicle) and an IL-1ra–vehicle group (IL-1ra). (B) Phosphorylated and total levels of Akt and CREB were evaluated by using Western blots. (C and D) Relative levels of p-Akt(Ser-473)/Akt (C) and p-CREB(Ser-33)/CREB (D) were normalized with vehicle-only treated controls [n = 5 per group; five independent experiments (neurons from different embryo litters)]. *P < 0.05; (*)P < 0.01; [*]P < 0.001 vs. vehicle control (ANOVA, Tukey’s post hoc test). Data are presented as mean ± SEM.
Fig. 3.
Fig. 3.
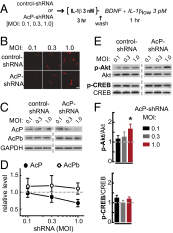
AcP knockdown attenuates the neuronal IL-1β inflammatory response. (A) Experimental design. Both control– and AcP–shRNA-transfected neurons (at 3 DIV) were treated identically (at 6–7 DIV): All cultures were preincubated with 3 nM IL-1β for 3 h, washed, and stimulated with BDNF (50 ng/mL) with IL-1βlow (3 pM) for 1 h, as indicated. AcP–shRNA targets a sequence in the unique 3′ terminal segment of the rat AcP mRNA, a sequence absent in rat AcPb mRNA (SI Methods). (B) RFP detection in primary rat hippocampal neurons transfected with increasing MOI of lentivirus. (Scale bar: 50 μm.) (C) Western blot analysis of AcP and AcPb levels; GAPDH was used as loading control. (D) Quantification: AcP (n = 8) and AcPb (n = 8) levels in AcP–shRNA-transfected neurons were normalized with corresponding levels from neurons transfected with equivalent MOI of control shRNA (dashed line). Results are from five independent experiments (neurons from different embryo litters). AcP vs. AcPb levels, P = 0.04 (two-way ANOVA main effect of shRNA; F3,44 = 2.99). (E) Western blot analysis of p-Akt (Ser-473) and p-CREB (Ser-133) levels (Akt and CREB levels as loading controls). (F) Quantification: After densitometry analysis, p-Akt (n = 8) and p-CREB (n = 7) levels in AcP–shRNA-transfected neurons were normalized with corresponding levels from neurons transfected with equivalent MOI of control shRNA (dashed line); results are from five independent experiments. AcPshRNA vs. control-shRNA (two way ANOVA): p-Akt, P = 0.01, effect of shRNA, F1,41 = 7.07; p-CREB, P = 0.17, effect of shRNA concentration, F1,36 = 1.96. *P < 0.05 (Bonferroni post hoc test for p-Akt). Data are presented as mean ± SEM.
Fig. 4.
Fig. 4.
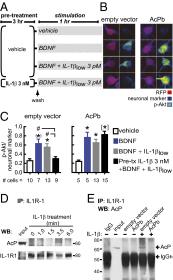
AcPb attenuates the neuronal IL-1β inflammatory response. (A) Primary rat hippocampal neurons were transfected with empty or AcPb-containing vectors at 3 DIV (AcPb gene sequence under the CMV promoter). After 3–4 d, neurons were preincubated with 3 nM IL-1β or vehicle for 3 h, washed, and stimulated with BDNF with or without IL-1βlow for 1 h, as indicated. (B) Phosphorylated levels of Akt (p-Akt; Ser-473) were assessed by immunofluorescence in RFP (reporter gene)-positive cells treated as indicated in A. Pan neuronal marker staining was used for cell-volume normalization. Representative images are shown. (Scale bar: 10 μm.) (C) p-Akt/pan-neuronal marker levels following the above treatments. The number of analyzed neurons is shown at the bottom of each treatment. Transfection itself did not interfere with BDNF signaling. Akt activation by BDNF was not impaired by IL-1βlow treatment alone (i.e., in the absence of IL-1β pretreatment) in either control- or AcPb-transfected neurons. Consistent with experiments in nontransfected cells (Fig. 2D), BDNF induction of p-Akt was prevented by IL-1βlow challenge after IL-1β pretreatment in control-transfected neurons. Bar graphs show data from a representative experiment (one out of four independent experiments). *P < 0.05; (*)P < 0.01; [*]P < 0.001 vs. control; #P < 0.05 (ANOVA, Tukey’s post hoc test). (D) Neurons were treated with 3 nM IL-1β for the indicated times. IL-1R1 immunoprecipitation (IP) was followed by Western blot (WB) for AcP and IL-1R1 (n = 3; three independent experiments). IL-1R1–AcP interaction was detected after 3.5 min, but not after 6 min, of IL-1β treatment, possibly due to MyD88 binding to the C-terminal domain of IL-1R1 (18), the same region recognized by the antibody used for IL-1R1 IP. (E) IL-1R1 IP was performed in neurons transfected with empty or AcPb-containing vectors. Neurons were treated with vehicle or IL-1β (3 nM, 3.5 min), as indicated. Membrane was probed for AcP; shown is a representative experiment (n = 3; three independent experiments). Data are presented as mean ± SEM.
Fig. 5.
Fig. 5.
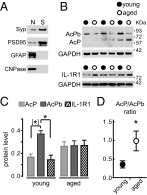
Aging reconfigures the IL-1 receptor in mouse hippocampal synaptosomes. (A) Hippocampal synaptosomes from young and middle-aged mice were purified by density gradient. Purity was evaluated by Western blot analysis of the synaptic markers synaptophysin (Syp) and PSD95 in nuclear (N) and synaptosome (S) fractions. Expression of astrocyte (glial fibrillary acidic protein; GFAP) and oligodendrocyte (2′,3′-cyclic nucleotide 3′-phosphodiesterase; CNPase) markers was not detected in synaptosome fractions. (B) AcP, AcPb, and IL-1R1 proteins detected by Western blot in hippocampal synaptosome samples. (C) Quantification of AcP, AcPb (n = 11 samples/group), and IL-1R1 (n = 7 samples per group) protein levels in synaptosomes from young (7–8 mo) and middle-aged (13–15 mo) mice. Fresh hippocampi from two mice were pooled for each sample. Values were normalized with corresponding GAPDH levels. AcP and AcPb detection for each sample was performed in duplicate, and values were averaged before statistical analysis. *P < 0.01; [*]P < 0.001 vs. AcPb in young mice (ANOVA, Tukey’s post hoc test). (D) AcP/AcPb protein ratio. *P < 0.05 (Mann–Whitney test). Data are presented as mean ± SEM.
Fig. 6.
Fig. 6.
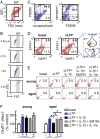
Sensitized IL-1β response in aged synapses suppresses cLTP via IL-1R1–AcP signaling. (A) Forward scatter (FSC) vs. side scatter (SSC) dot plot showing the size–complexity profile of gated particles (inside rectangle, size-gated synaptosomes). (B) FSC–SSC dot plots using 0.5-, 0.75-, 1.0-, and 3.0-μm calibrated beads. Gray area represents the size range used to select putative synaptosomes particles: 0.5 μm < gated particles ≤ 3.0 μm. (C) Two-color parameter density plots showing synaptophysin–PSD95 (Left) and synapsin–I-PSD95 (Right) double-labeling in size-gated synaptosomes. Thresholds for endogenous/nonspecific fluorescence for each marker are set by using secondary antibody staining only (lower left quadrant). Note that a high proportion of particles coexpress presynaptic and postsynaptic markers (>60%). Representative plots of one experiment out of five are shown. (D, Left and Center) Two-color parameter density plots showing Nrx1β and GluR1 surface detection in size-gated synaptosomes before and after cLTP. GluR1–Nrx1β double-positive events (upper right quadrant) increase after cLTP. (D, Right) The model illustrates the insertion of Nrx1β- and GluR1-containing endosomes after cLTP detected in single events by FASS-LTP. (E) FASS-LTP was performed in fresh synaptosome fractions obtained from young (6–7 mo; n = 7) and middle-aged (13–15 mo; n = 6) mice. IL-1βlow or external solution was added 5 min before cLTP induction. EM-163 (20 µM), IL-1ra (3 µM), or equivalent volumes of external solution were added 10 min before IL-1βlow (3 pM) treatment. The upper right quadrant shows the proportion of GluR1–Nrx1β double-positive events detected after 45 min of cLTP in each experimental condition. (F) Overall data presented as mean ± SEM. *P < 0.05 (ANOVA, Tukey’s post hoc test).
Fig. S4.
Fig. S4.
The potentiated IL-1β inflammatory response is blocked by TIR mimetics. (A) Experimental design: Primary rat hippocampal neurons (5–7 DIV) were preincubated with vehicle or IL-1β (3 nM, 3 h). After washing, vehicle-treated neurons were exposed to BDNF (50 ng/mL, 1 h) or vehicle, and neurons pretreated with IL-1β were stimulated with BDNF in the presence of IL-1βlow (1 h). The effect of TIR mimetics was tested in neurons pretreated with IL-1β and stimulated with BDNF/IL-1βlow, with TIR mimetics AS1 or EM163 (20 μM) added during the last 15 min of IL-1β pretreatment and during the BDNF/IL-1βlow cotreatment. (B) Western blot analysis of phosphorylated levels of TrkB, Akt, mTOR and CREB (n = 8 per group) with GAPDH used as loading control. (CF) Western blot quantification: p-TrkB (C), p-Akt (D), p-mTOR (E), and p-CREB (F) levels were normalized with vehicle-treated neurons (vehicle). *P < 0.05; (*)P < 0.01 vs. control (one-way ANOVA, Tukey’s post hoc test). Data are presented as mean ± SEM.
Fig. 7.
Fig. 7.
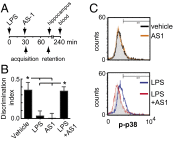
TIR (IL-1R1–AcP)-dependent IL-1β signaling mediates the memory impairment induced by LPS in old mice. (A) Experimental design: 20- to 22-mo-old mice were injected with saline or LPS (0.3 mg/kg, i.p.) and 30 min later with AS1 (200 mg/kg, i.p.) or an equivalent volume of DMSO. OLM task was undertaken immediately after AS1 injection. The acquisition trial (5 min) was followed 45 min later by the retention test trial (5 min). All mice spent equal time exploring both objects in the acquisition trial, indicating no preference for either location (P = 0.40; ANOVA). Mice were euthanized immediately after test trial to obtain the hippocampus. (B) Discrimination index (n = 7 per group). *P < 0.05 (ANOVA, Tukey’s post hoc test). Data are presented as mean ± SEM. (C) Levels of p-p38 (Thr-180/Tyr-182) in size-gated hippocampal synaptosomes from mice used for OLM task. Background fluorescence was determined by using a PE-conjugated control isotype antibody (gray filled histogram) (n = 4 per group). P < 0.01, LPS vs. LPS+AS1 (Kolmogorov–Smirnov test).

Similar articles

Cited by

References

    1. Lynch MA. Age-related impairment in long-term potentiation in hippocampus: A role for the cytokine, interleukin-1 beta? Prog Neurobiol. 1998;56(5):571–589. - PubMed
    1. Trompet S, et al. PROSPER Group Genetic variation in the interleukin-1 beta-converting enzyme associates with cognitive function. The PROSPER study. Brain. 2008;131(Pt 4):1069–1077. - PubMed
    1. Youm YH, et al. Canonical Nlrp3 inflammasome links systemic low-grade inflammation to functional decline in aging. Cell Metab. 2013;18(4):519–532. - PMC - PubMed
    1. Murray CA, Lynch MA. Evidence that increased hippocampal expression of the cytokine interleukin-1 beta is a common trigger for age- and stress-induced impairments in long-term potentiation. J Neurosci. 1998;18(8):2974–2981. - PMC - PubMed
    1. Patterson SL. Immune dysregulation and cognitive vulnerability in the aging brain: Interactions of microglia, IL-1β, BDNF and synaptic plasticity. Neuropharmacology. 2015;96(Pt A):11–18. - PMC - PubMed

Publication types

MeSH terms

Substances