

Fibroblast activation protein-α, a stromal cell surface protease, shapes key features of cancer associated fibroblasts through proteome and degradome alterations
- PMID: 26304112
- PMCID: PMC5528924
- DOI: 10.1016/j.molonc.2015.08.001
Fibroblast activation protein-α, a stromal cell surface protease, shapes key features of cancer associated fibroblasts through proteome and degradome alterations
Abstract
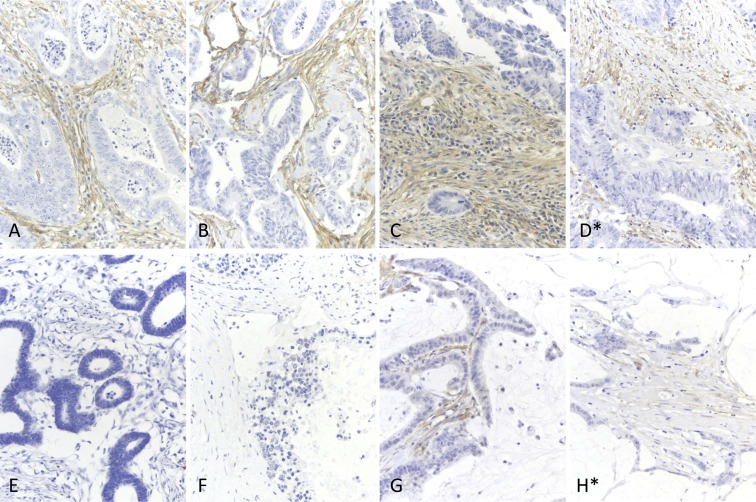
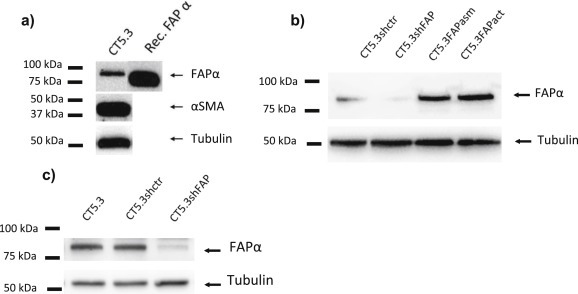
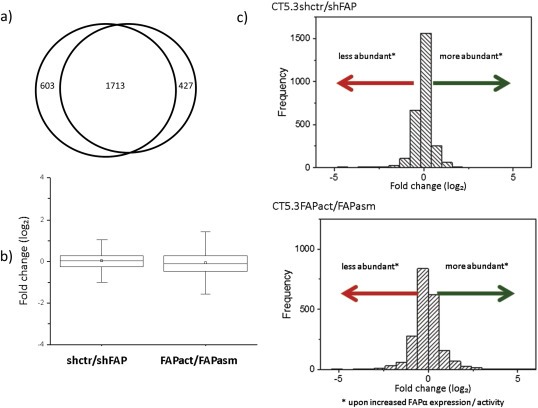
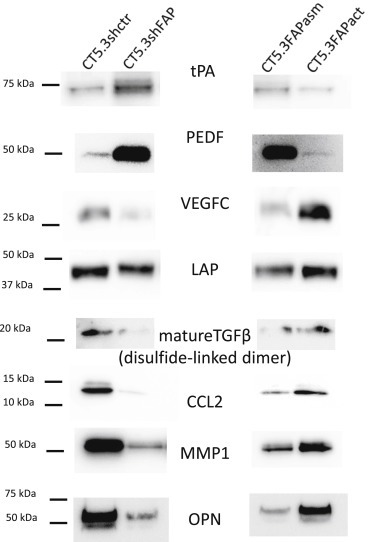
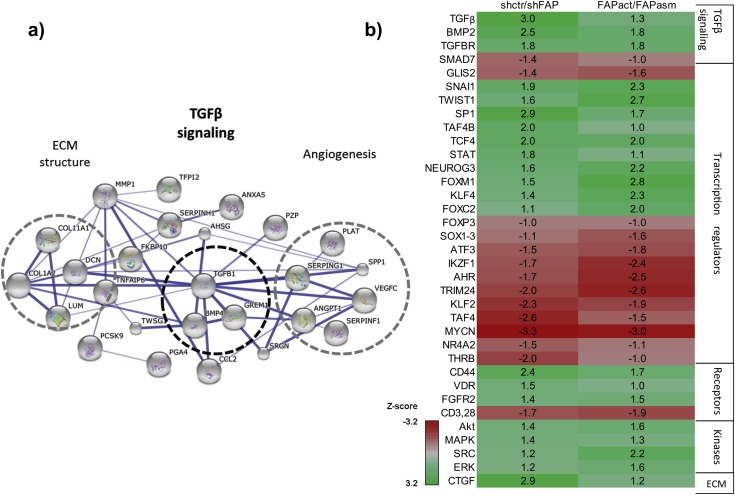
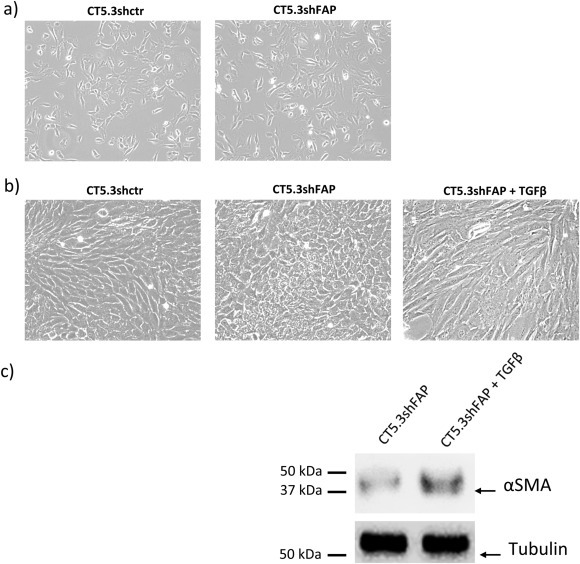
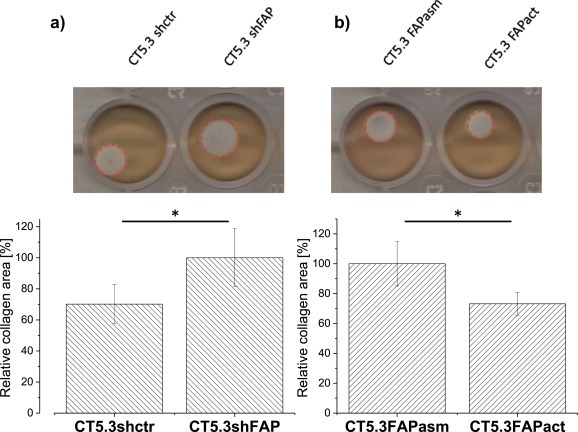
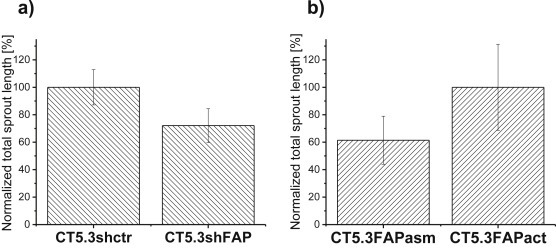
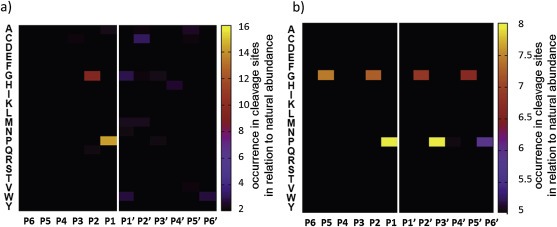
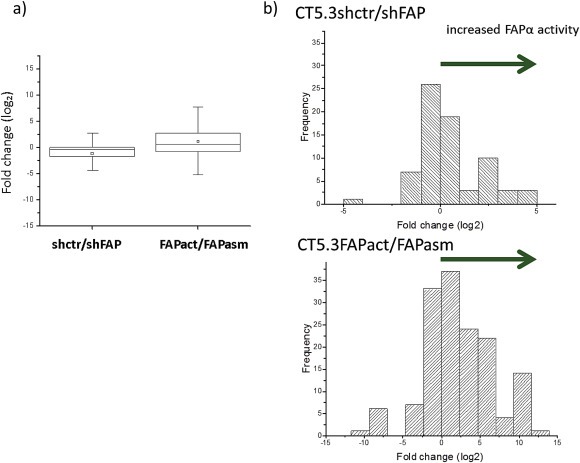
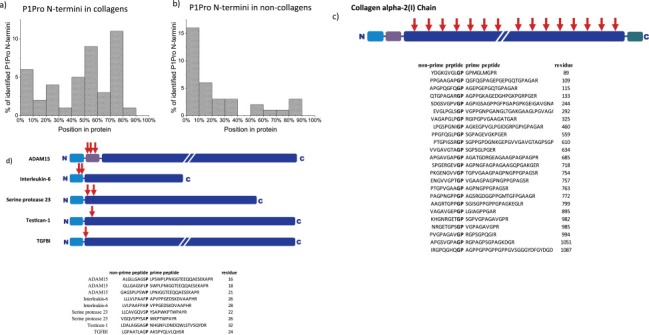
Cancer associated fibroblasts (CAFs) constitute an abundant stromal component of most solid tumors. Fibroblast activation protein (FAP) α is a cell surface protease that is expressed by CAFs. We corroborate this expression profile by immunohistochemical analysis of colorectal cancer specimens. To better understand the tumor-contextual role of FAPα, we investigate how FAPα shapes functional and proteomic features of CAFs using loss- and gain-of function cellular model systems. FAPα activity has a strong impact on the secreted CAF proteome ("secretome"), including reduced levels of anti-angiogenic factors, elevated levels of transforming growth factor (TGF) β, and an impact on matrix processing enzymes. Functionally, FAPα mildly induces sprout formation by human umbilical vein endothelial cells. Moreover, loss of FAPα leads to a more epithelial cellular phenotype and this effect was rescued by exogenous application of TGFβ. In collagen contraction assays, FAPα induced a more contractile cellular phenotype. To characterize the proteolytic profile of FAPα, we investigated its specificity with proteome-derived peptide libraries and corroborated its preference for cleavage carboxy-terminal to proline residues. By "terminal amine labeling of substrates" (TAILS) we explored FAPα-dependent cleavage events. Although FAPα acts predominantly as an amino-dipeptidase, putative FAPα cleavage sites in collagens are present throughout the entire protein length. In contrast, putative FAPα cleavage sites in non-collagenous proteins cluster at the amino-terminus. The degradomic study highlights cell-contextual proteolysis by FAPα with distinct positional profiles. Generally, our findings link FAPα to key aspects of CAF biology and attribute an important role in tumor-stroma interaction to FAPα.
Keywords: Angiogenesis; CAFs; Degradome; FAPα; Secretome; TGFβ.
Copyright © 2015 Federation of European Biochemical Societies. Published by Elsevier B.V. All rights reserved.
Figures
Similar articles
-
The stromal cell-surface protease fibroblast activation protein-α localizes to lipid rafts and is recruited to invadopodia.Biochim Biophys Acta. 2015 Oct;1853(10 Pt A):2515-25. doi: 10.1016/j.bbamcr.2015.07.013. Epub 2015 Jul 23. Biochim Biophys Acta. 2015. PMID: 26209915
-
Comparisons of cancer-associated fibroblasts in the intratumoral stroma and invasive front in colorectal cancer.Medicine (Baltimore). 2019 May;98(18):e15164. doi: 10.1097/MD.0000000000015164. Medicine (Baltimore). 2019. PMID: 31045759 Free PMC article.
-
FAP-overexpressing fibroblasts produce an extracellular matrix that enhances invasive velocity and directionality of pancreatic cancer cells.BMC Cancer. 2011 Jun 13;11:245. doi: 10.1186/1471-2407-11-245. BMC Cancer. 2011. PMID: 21668992 Free PMC article.
-
Fibroblast Activation Protein Alpha (FAPα) in Fibrosis: Beyond a Perspective Marker for Activated Stromal Cells?Biomolecules. 2023 Nov 29;13(12):1718. doi: 10.3390/biom13121718. Biomolecules. 2023. PMID: 38136590 Free PMC article. Review.
-
[FIBROBLAST ACTIVATION PROTEIN (FAP) AS A POSSIBLE TARGET OF THE ANTITUMOR STRATEGY.].Mol Gen Mikrobiol Virusol. 2016;34(3):90-97. Mol Gen Mikrobiol Virusol. 2016. PMID: 30383930 Review. Russian.
Cited by
-
Head-to-head evaluation of [18F]FDG and [68 Ga]Ga-DOTA-FAPI-04 PET/CT in recurrent soft tissue sarcoma.Eur J Nucl Med Mol Imaging. 2022 Jul;49(8):2889-2901. doi: 10.1007/s00259-022-05700-4. Epub 2022 Feb 3. Eur J Nucl Med Mol Imaging. 2022. PMID: 35113192 Free PMC article.
-
Cancer-associated fibroblast regulation of tumor neo-angiogenesis as a therapeutic target in cancer.Oncol Lett. 2019 Mar;17(3):3055-3065. doi: 10.3892/ol.2019.9973. Epub 2019 Jan 25. Oncol Lett. 2019. PMID: 30867734 Free PMC article. Review.
-
State-of-the-art of FAPI-PET imaging: a systematic review and meta-analysis.Eur J Nucl Med Mol Imaging. 2021 Dec;48(13):4396-4414. doi: 10.1007/s00259-021-05475-0. Epub 2021 Jun 25. Eur J Nucl Med Mol Imaging. 2021. PMID: 34173007
-
Fibroblast activation protein alpha is expressed by transformed and stromal cells and is associated with mesenchymal features in glioblastoma.Tumour Biol. 2016 Oct;37(10):13961-13971. doi: 10.1007/s13277-016-5274-9. Epub 2016 Aug 4. Tumour Biol. 2016. PMID: 27492457
-
IDH-wildtype glioblastomas and grade III/IV IDH-mutant gliomas show elevated tracer uptake in fibroblast activation protein-specific PET/CT.Eur J Nucl Med Mol Imaging. 2019 Nov;46(12):2569-2580. doi: 10.1007/s00259-019-04444-y. Epub 2019 Aug 6. Eur J Nucl Med Mol Imaging. 2019. PMID: 31388723
References
-
- Acharya, P.S. , Zukas, A. , 2006. Fibroblast activation protein: a serine protease expressed at the remodeling interface in idiopathic pulmonary fibrosis. Hum. Pathol. 37, (3) 352–360. - PubMed
-
- Aertgeerts, K. , Levin, I. , 2005. Structural and kinetic analysis of the substrate specificity of human fibroblast activation protein alpha. J. Biol. Chem. 280, (20) 19441–19444. - PubMed
-
- Ariga, N. , Sato, E. , 2001. Stromal expression of fibroblast activation protein/seprase, a cell membrane serine proteinase and gelatinase, is associated with longer survival in patients with invasive ductal carcinoma of breast. Int. J. Cancer. 95, (1) 67–72. - PubMed
Publication types
MeSH terms
Substances
LinkOut - more resources
Full Text Sources
Other Literature Sources
Medical
Miscellaneous
