

Review
doi: 10.1016/j.spinee.2014.09.010.
Novel diagnostic and prognostic methods for disc degeneration and low back pain
Affiliations
- PMID: 26303178
- PMCID: PMC5473425
- DOI: 10.1016/j.spinee.2014.09.010
Item in Clipboard
Review
Novel diagnostic and prognostic methods for disc degeneration and low back pain
Spine J.
.
No abstract available
Figures
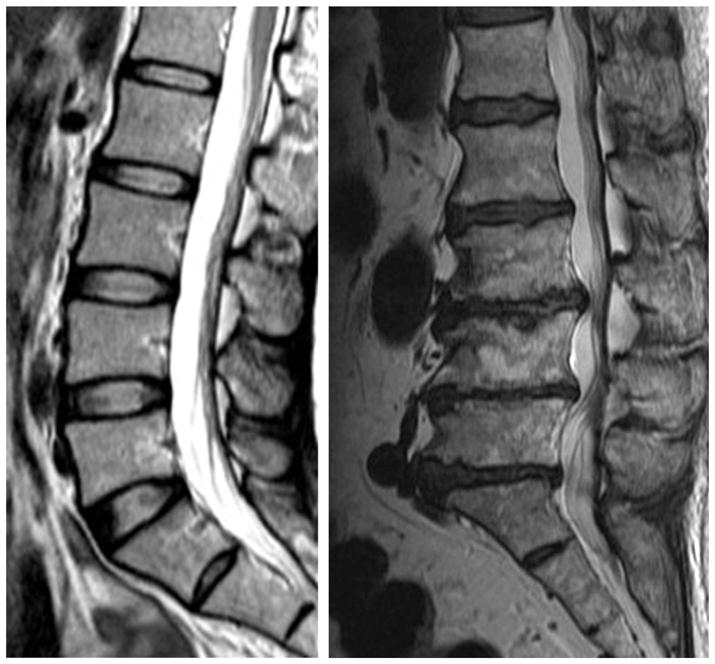
Sagittal T2-weighted magnetic resonace imaging of the lumbar spine. (Left) Normal hydrated discs manifesting as high signal intensity in an asymptomatic subject. (Right) Loss of disc signal intensity, with multiple levels of decreased disc height, Modic changes, end-plate abnormalities, disc displacement, and loss of lumbar lordosis in an individual with low back pain.
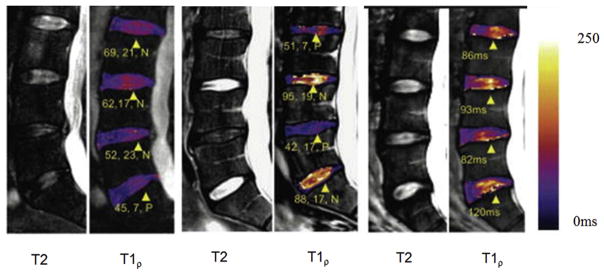
Representative proton T2 magnetic resonace imaging (gray scale) and corresponding T1ρ maps (in color overlaid on gray-scale T1ρ-weighted image) of the lumbar discs from (Left) a 52-year-old female and (Middle) a 35-year-old male patients diagnosed with low back pain and from (Right) an asymptomatic 38-year-old man. Average T1ρ (in milliseconds) was measured in the disc nucleus and is displayed below each disc, followed by the opening pressure (in psi) and whether discs were painful (P) or nonpainful (N), both determined by discography are indicated in the lower back pain patients [136].
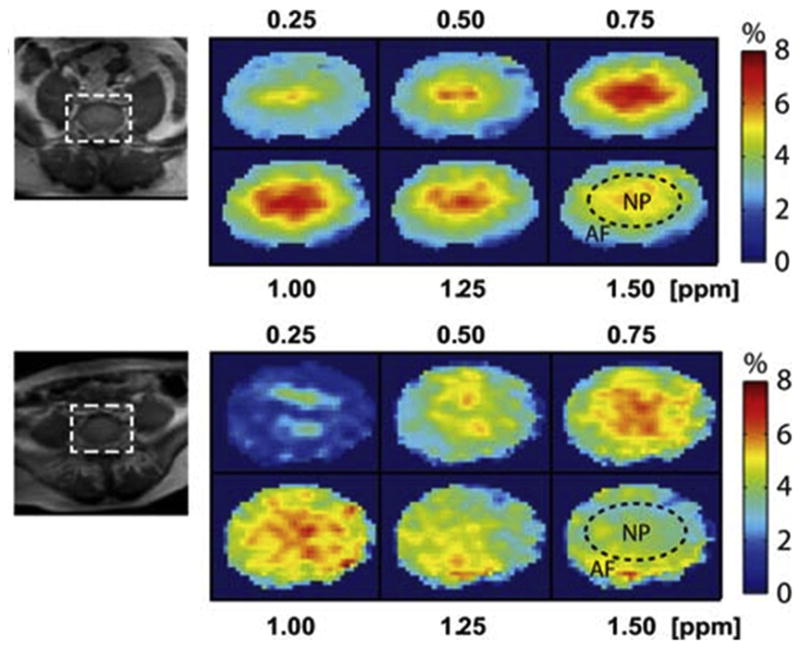
A glycosaminoglycan map of the intervertebral disc is determined using the magnetic resonace imaging glycosaminoglycan chemical exchange saturation transfer (gagCEST) method in two subjects: (Top) a 25-year-old woman at L5–S1 and (Bottom) a 54-year-old man at L5–S1. The nucleus pulposus is delineated from the annulus fibrosus (AF) region by the dotted oval in the 1.5-ppm images. The gagCEST maps are shown at different frequency offsets relative to water at 0 ppm. In both subjects, the gagCEST effect is highest in the 0.75- to 1-ppm range of frequency offsets [84].
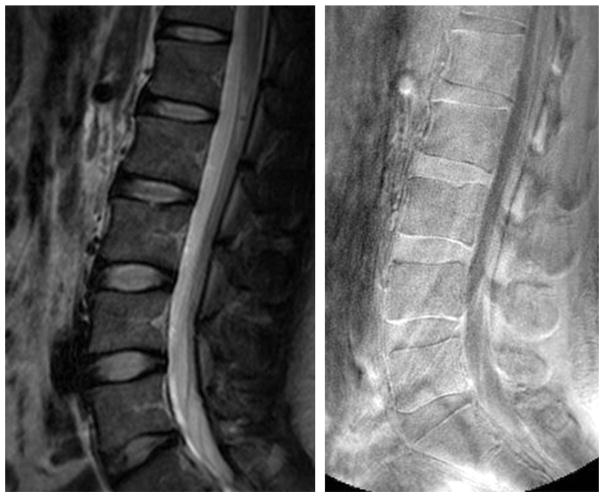
(Left) T2-weighted magnetic resonace imaging (MRI) of the lumbar spine and its corresponding (Right) ultrashort time-to-echo MRI.
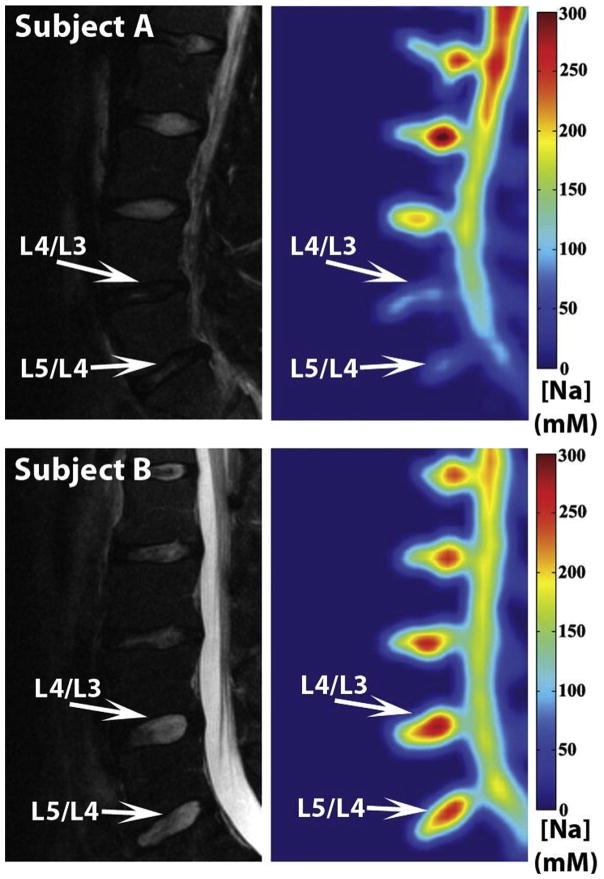
Representative proton T2-weighted magnetic resonace imaging (gray scale) and corresponding sodium maps (color) obtained in vivo. (Top) A 22-year-old man with lower lumbar trauma that resulted in chronic low back pain. (Bottom) A 26-year-old asymptomatic man [98].
Comment in
-
Bringing truths from evidence: novel ways to detect pain derivation of low back.Spine J. 2016 May;16(5):676. doi: 10.1016/j.spinee.2015.10.059. Spine J. 2016. PMID: 27261846 No abstract available.
Similar articles
-
Patterns of lumbar disc degeneration are different in degenerative disc disease and disc prolapse magnetic resonance imaging analysis of 224 patients.Spine J. 2014 Feb 1;14(2):300-7. doi: 10.1016/j.spinee.2013.10.042. Epub 2013 Nov 12. Spine J. 2014. PMID: 24231779
-
A population-based study of juvenile disc degeneration and its association with overweight and obesity, low back pain, and diminished functional status.J Bone Joint Surg Am. 2011 Apr 6;93(7):662-70. doi: 10.2106/JBJS.I.01568. J Bone Joint Surg Am. 2011. PMID: 21471420
-
Disc degeneration and chronic low back pain: an association which becomes nonsignificant when endplate changes and disc contour are taken into account.Neuroradiology. 2014 Jan;56(1):25-33. doi: 10.1007/s00234-013-1294-y. Epub 2013 Nov 5. Neuroradiology. 2014. PMID: 24190653
-
Imaging the back pain patient.Phys Med Rehabil Clin N Am. 2010 Nov;21(4):725-66. doi: 10.1016/j.pmr.2010.07.004. Phys Med Rehabil Clin N Am. 2010. PMID: 20977958 Review.
-
New treatments and imaging strategies in degenerative disease of the intervertebral disks.Radiology. 2012 Jul;264(1):6-19. doi: 10.1148/radiol.12110339. Radiology. 2012. PMID: 22723559 Review.
Cited by
-
Classification of High Intensity Zones of the Lumbar Spine and Their Association with Other Spinal MRI Phenotypes: The Wakayama Spine Study.PLoS One. 2016 Sep 20;11(9):e0160111. doi: 10.1371/journal.pone.0160111. eCollection 2016. PLoS One. 2016. PMID: 27649071 Free PMC article.
-
The relationship between chest pain intensity and physiological indicators after coronary artery bypass grafting: A correlational study.Turk Gogus Kalp Damar Cerrahisi Derg. 2019 Apr 24;27(2):173-177. doi: 10.5606/tgkdc.dergisi.2019.17517. eCollection 2019 Apr. Turk Gogus Kalp Damar Cerrahisi Derg. 2019. PMID: 32082849 Free PMC article.
-
Advancing cell therapies for intervertebral disc regeneration from the lab to the clinic: Recommendations of the ORS spine section.JOR Spine. 2018 Dec;1(4):e1036. doi: 10.1002/jsp2.1036. Epub 2018 Oct 8. JOR Spine. 2018. PMID: 30895277 Free PMC article. Review.
-
Low back pain in older adults: risk factors, management options and future directions.Scoliosis Spinal Disord. 2017 Apr 18;12:14. doi: 10.1186/s13013-017-0121-3. eCollection 2017. Scoliosis Spinal Disord. 2017. PMID: 28435906 Free PMC article. Review.
-
The UTE Disc Sign on MRI: A Novel Imaging Biomarker Associated With Degenerative Spine Changes, Low Back Pain, and Disability.Spine (Phila Pa 1976). 2018 Apr 1;43(7):503-511. doi: 10.1097/BRS.0000000000002369. Spine (Phila Pa 1976). 2018. PMID: 28767621 Free PMC article.
References
-
- Andersson GB. Epidemiological features of chronic low-back pain. Lancet. 1999;354:581–5. - PubMed
-
- Ekman M, Jonhagen S, Hunsche E, Jonsson L. Burden of illness of chronic low back pain in Sweden: a cross-sectional, retrospective study in primary care setting. Spine. 2005;30:1777–85. - PubMed
-
- Deyo RA, Tsui-Wu YJ. Descriptive epidemiology of low-back pain and its related medical care in the United States. Spine. 1987;12:264–8. - PubMed
-
- Shen FH, Samartzis D, Andersson GB. Nonoperative management of acute and chronic low back pain. J Am Acad Ortho Surg. 2006;14:477–87. - PubMed
Publication types
MeSH terms
Grants and funding
LinkOut - more resources
Full Text Sources
Other Literature Sources
Medical
