

Meta-analysis of shared genetic architecture across ten pediatric autoimmune diseases
- PMID: 26301688
- PMCID: PMC4863040
- DOI: 10.1038/nm.3933
Meta-analysis of shared genetic architecture across ten pediatric autoimmune diseases
Abstract
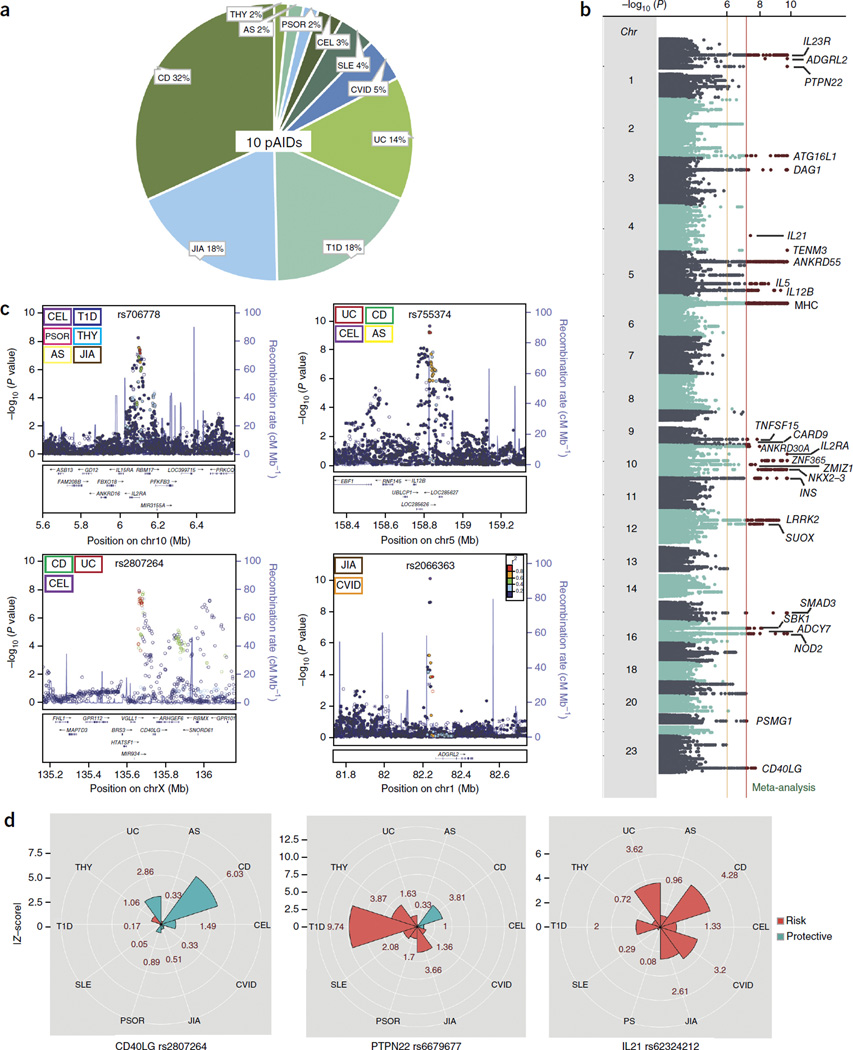
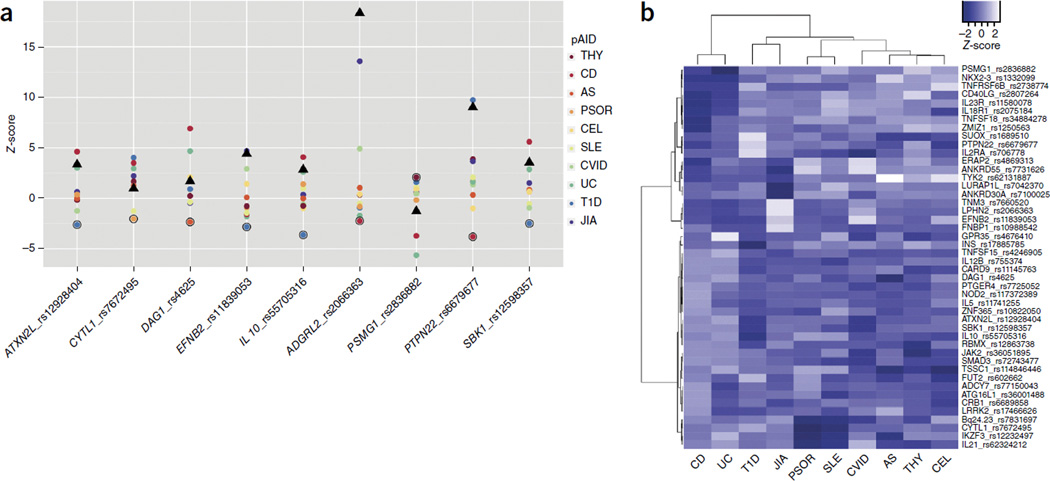
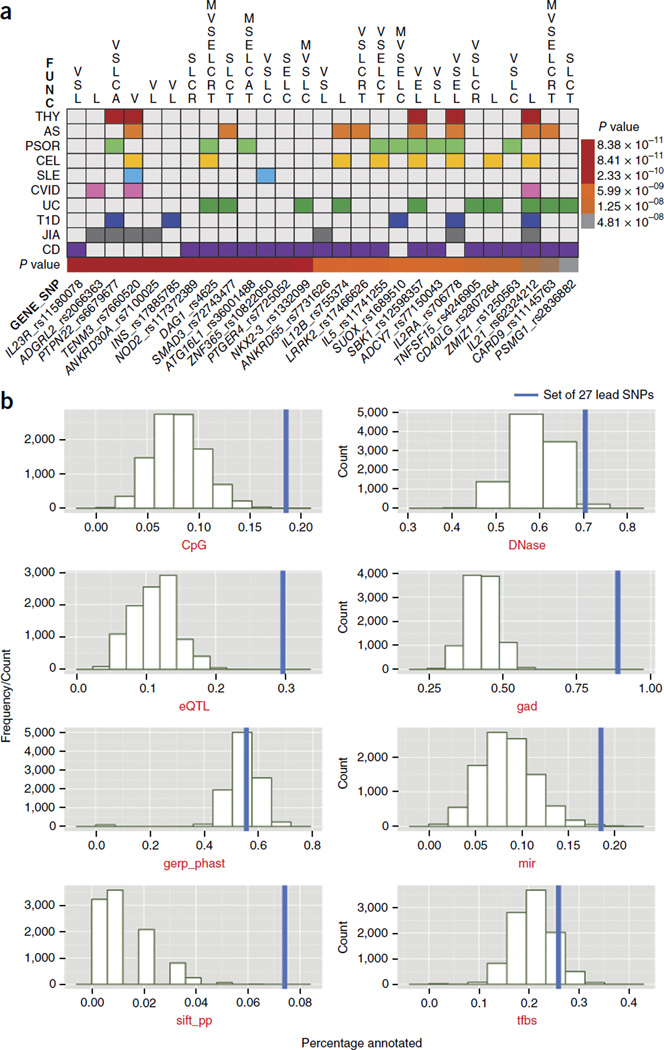
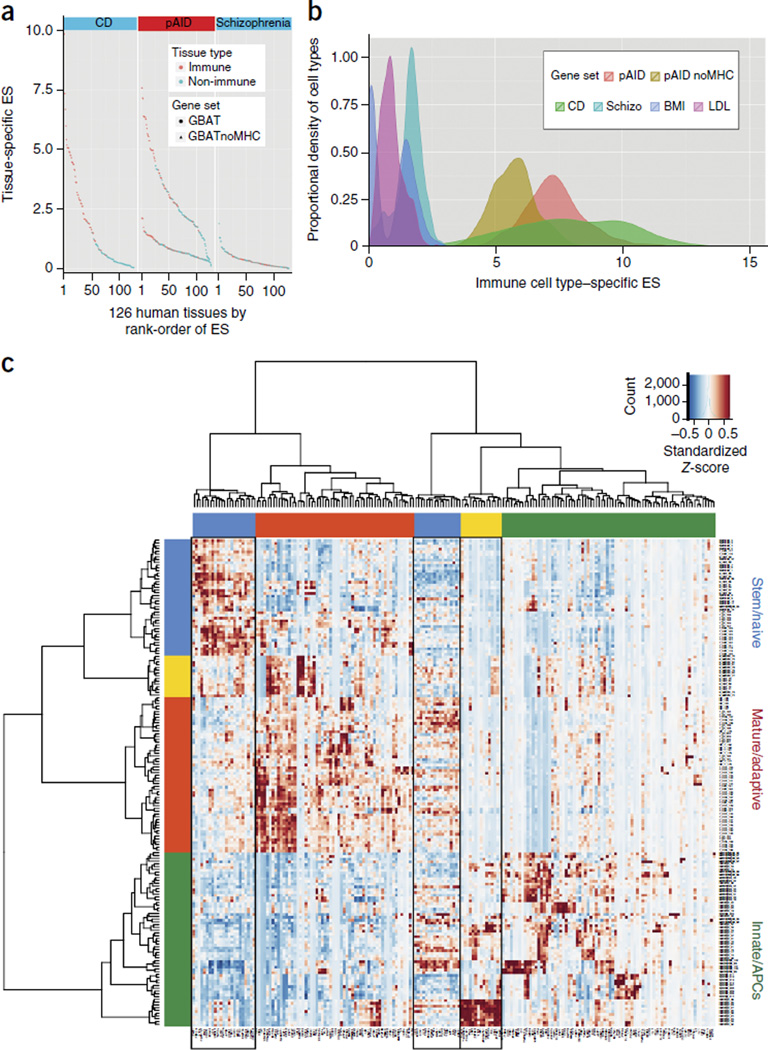
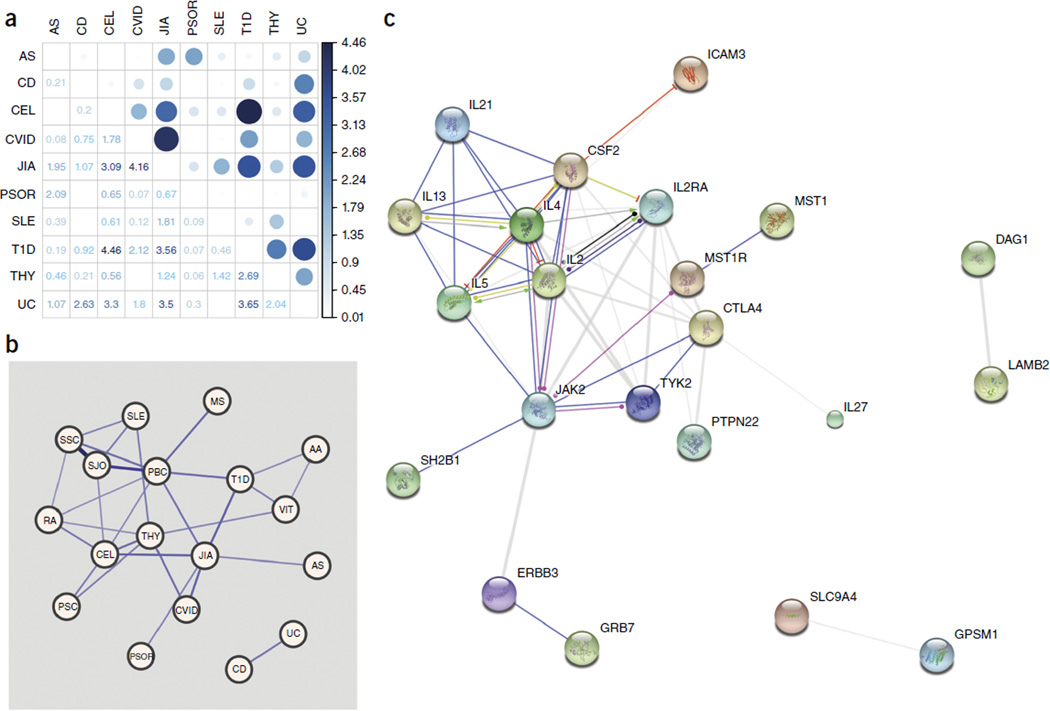
Genome-wide association studies (GWASs) have identified hundreds of susceptibility genes, including shared associations across clinically distinct autoimmune diseases. We performed an inverse χ(2) meta-analysis across ten pediatric-age-of-onset autoimmune diseases (pAIDs) in a case-control study including more than 6,035 cases and 10,718 shared population-based controls. We identified 27 genome-wide significant loci associated with one or more pAIDs, mapping to in silico-replicated autoimmune-associated genes (including IL2RA) and new candidate loci with established immunoregulatory functions such as ADGRL2, TENM3, ANKRD30A, ADCY7 and CD40LG. The pAID-associated single-nucleotide polymorphisms (SNPs) were functionally enriched for deoxyribonuclease (DNase)-hypersensitivity sites, expression quantitative trait loci (eQTLs), microRNA (miRNA)-binding sites and coding variants. We also identified biologically correlated, pAID-associated candidate gene sets on the basis of immune cell expression profiling and found evidence of genetic sharing. Network and protein-interaction analyses demonstrated converging roles for the signaling pathways of type 1, 2 and 17 helper T cells (TH1, TH2 and TH17), JAK-STAT, interferon and interleukin in multiple autoimmune diseases.
Figures
Comment in
-
Genetics. Meta-analysis reveals novel overlap in genetic aetiologies of paediatric autoimmune disorders.Nat Rev Rheumatol. 2015 Oct;11(10):561. doi: 10.1038/nrrheum.2015.120. Epub 2015 Sep 8. Nat Rev Rheumatol. 2015. PMID: 26345117 No abstract available.
Similar articles
-
A genome-wide cross-trait analysis identifying shared genetic basis and causal relationships between Hunner-type interstitial cystitis and autoimmune diseases in East Asian populations.Front Immunol. 2024 Nov 15;15:1417899. doi: 10.3389/fimmu.2024.1417899. eCollection 2024. Front Immunol. 2024. PMID: 39620209 Free PMC article.
-
Defining the optimum strategy for identifying adults and children with coeliac disease: systematic review and economic modelling.Health Technol Assess. 2022 Oct;26(44):1-310. doi: 10.3310/ZUCE8371. Health Technol Assess. 2022. PMID: 36321689 Free PMC article.
-
Human candidate gene polymorphisms and risk of severe malaria in children in Kilifi, Kenya: a case-control association study.Lancet Haematol. 2018 Aug;5(8):e333-e345. doi: 10.1016/S2352-3026(18)30107-8. Epub 2018 Jul 20. Lancet Haematol. 2018. PMID: 30033078 Free PMC article.
-
The effectiveness of abstinence-based and harm reduction-based interventions in reducing problematic substance use in adults who are experiencing homelessness in high income countries: A systematic review and meta-analysis: A systematic review.Campbell Syst Rev. 2024 Apr 21;20(2):e1396. doi: 10.1002/cl2.1396. eCollection 2024 Jun. Campbell Syst Rev. 2024. PMID: 38645303 Free PMC article. Review.
-
Mobile phone text messaging for medication adherence in secondary prevention of cardiovascular disease.Cochrane Database Syst Rev. 2024 Mar 27;3(3):CD011851. doi: 10.1002/14651858.CD011851.pub3. Cochrane Database Syst Rev. 2024. PMID: 38533994 Free PMC article. Review.
Cited by
-
Targeting Adenylate Cyclase Family: New Concept of Targeted Cancer Therapy.Front Oncol. 2022 Jun 27;12:829212. doi: 10.3389/fonc.2022.829212. eCollection 2022. Front Oncol. 2022. PMID: 35832555 Free PMC article. Review.
-
Urine Proteomics and Renal Single-Cell Transcriptomics Implicate Interleukin-16 in Lupus Nephritis.Arthritis Rheumatol. 2022 May;74(5):829-839. doi: 10.1002/art.42023. Epub 2022 Apr 16. Arthritis Rheumatol. 2022. PMID: 34783463 Free PMC article.
-
Determining the impact of uncharacterized inversions in the human genome by droplet digital PCR.Genome Res. 2020 May;30(5):724-735. doi: 10.1101/gr.255273.119. Epub 2020 May 18. Genome Res. 2020. PMID: 32424072 Free PMC article.
-
International Union of Basic and Clinical Pharmacology. CI. Structures and Small Molecule Modulators of Mammalian Adenylyl Cyclases.Pharmacol Rev. 2017 Apr;69(2):93-139. doi: 10.1124/pr.116.013078. Pharmacol Rev. 2017. PMID: 28255005 Free PMC article. Review.
-
Genome editing to define the function of risk loci and variants in rheumatic disease.Nat Rev Rheumatol. 2021 Aug;17(8):462-474. doi: 10.1038/s41584-021-00637-8. Epub 2021 Jun 29. Nat Rev Rheumatol. 2021. PMID: 34188205 Free PMC article. Review.
References
Publication types
MeSH terms
Grants and funding
- G0800675/MRC_/Medical Research Council/United Kingdom
- G0600329/MRC_/Medical Research Council/United Kingdom
- HHMI/Howard Hughes Medical Institute/United States
- ETM/75/CSO_/Chief Scientist Office/United Kingdom
- RC1AR058606/AR/NIAMS NIH HHS/United States
- R01 HG006849/HG/NHGRI NIH HHS/United States
- P01 AI061093/AI/NIAID NIH HHS/United States
- R18 AI048693/AI/NIAID NIH HHS/United States
- UL1 TR001425/TR/NCATS NIH HHS/United States
- F30 AR066486/AR/NIAMS NIH HHS/United States
- CA127334/CA/NCI NIH HHS/United States
- RC1 AR058587/AR/NIAMS NIH HHS/United States
- RC1 AR058606/AR/NIAMS NIH HHS/United States
- U01HG006830/HG/NHGRI NIH HHS/United States
- DP3 DK085708/DK/NIDDK NIH HHS/United States
- G0800759/MRC_/Medical Research Council/United Kingdom
- M01 RR008084/RR/NCRR NIH HHS/United States
- MRF_C0482/MRF/MRF/United Kingdom
- 076113/WT_/Wellcome Trust/United Kingdom
- U24 AI086037/AI/NIAID NIH HHS/United States
- ETM/137/CSO_/Chief Scientist Office/United Kingdom
- R01-HG006849/HG/NHGRI NIH HHS/United States
- WT_/Wellcome Trust/United Kingdom
- P30 AR047363/AR/NIAMS NIH HHS/United States
- DP3DK085708/DK/NIDDK NIH HHS/United States
- R01 CA127334/CA/NCI NIH HHS/United States
- U01 HG006830/HG/NHGRI NIH HHS/United States
LinkOut - more resources
Full Text Sources
Other Literature Sources
Medical
