. 2015 Aug 24:6:8054.
doi: 10.1038/ncomms9054.

Tbx15 controls skeletal muscle fibre-type determination and muscle metabolism

Affiliations

Tbx15 controls skeletal muscle fibre-type determination and muscle metabolism

Kevin Y Lee et al. Nat Commun. .

Abstract

Skeletal muscle is composed of both slow-twitch oxidative myofibers and fast-twitch glycolytic myofibers that differentially impact muscle metabolism, function and eventually whole-body physiology. Here we show that the mesodermal transcription factor T-box 15 (Tbx15) is highly and specifically expressed in glycolytic myofibers. Ablation of Tbx15 in vivo leads to a decrease in muscle size due to a decrease in the number of glycolytic fibres, associated with a small increase in the number of oxidative fibres. This shift in fibre composition results in muscles with slower myofiber contraction and relaxation, and also decreases whole-body oxygen consumption, reduces spontaneous activity, increases adiposity and glucose intolerance. Mechanistically, ablation of Tbx15 leads to activation of AMPK signalling and a decrease in Igf2 expression. Thus, Tbx15 is one of a limited number of transcription factors to be identified with a critical role in regulating glycolytic fibre identity and muscle metabolism.


Figures
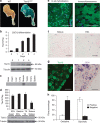
Figure 1
Figure 1. Tbx15 is highly and specifically expressed in glycolytic skeletal muscle.
(a) X-gal-stained hind limbs from 3-month-old Tbx15LacZ/+ males. (b) qPCR analysis of Tbx15 expression from C2C12 cells during myogenic differentiation. Data are shown as mean±s.e.m. of triplicate samples and repeated three times (upper panel). Western blot of Tbx15 from protein extracts from the same cells using tubulin as a loading control (lower panel). (c) Expression level of Tbx15 mRNA was compared by northern blot of RNA isolated from tissues from of 8-week-old male and female (ovary) C57BL/6 mice. This experiment has been performed once. (d) qPCR analysis of Tbx15 expression from muscle groups of 8-week-old male C57BL/6 mice. Data are shown as mean±s.e.m. of six samples (upper panel). Western blot of Tbx15 from protein extracts made from the same muscles using tubulin as a loading control (lower panel). (e) Fluorescent in situ hybridization for Tbx15 in quadriceps muscle and immunofluorescence for Tbx15 in tibialis anterior muscle of 8-week-old random fed male mice. The photographs were taken at × 10 magnification. The photographs were taken at × 10 magnification. Scale bar, 100 μM. (f) X-gal-stained representative sections of soleus and EDL from 8-week-old Tbx15LacZ males (n=3). Slides were lightly counterstained with eosin. Pictures were taken at × 20 magnification. Scale bar, 50 μM. (g) Immunofluorescence for Tbx15 and succinate dehydrogenase staining was performed on serial sections of tibialis anterior muscle of 8-week-old random fed male mice. Glycolytic fibres are marked with red crosses. The photographs were taken at × 10 magnification. Scale bar, 100 μM (h) Immunofluorescence for Tbx15 and succinate dehydrogenase staining was performed on serial sections. Five digital images (× 20) from non-overlapping fields were taken from each slide (total 20 fields per group), and oxidative and glycolytic muscle fibres were scored for Tbx15 expression. Values are mean±s.e.m. of four animals.
Figure 2
Figure 2. Ablation of Tbx15 increases oxidative fibre density, reduces muscle mass and increases fibre diameter.
(a) qPCR analysis for Tbx15 mRNA of RNA isolated from the tibialis anterior of male wild-type (WT), Tbx15+/− and Tbx15−/− mice at 6–8 weeks of age. Data are shown as mean±s.e.m. of three to eight animals per group. Asterisks indicate significant differences in all panels. (*P<0.05; **P<0.01; ***P<0.001 by analysis of variance). (b) Mass of soleus, extensor digitorum longus (EDL) and tibialis anterior (TA) of male WT, Tbx15+/− and Tbx15−/− mice at 6–8 weeks of age normalized to body weight. Data are shown as mean±s.e.m. of three to eight animals per group. (c) Succinate dehydrogenase (SDH) staining (top panels) from tibealis anterior and immunofluorescence for myosin I, IIa and IIb (bottom panels) from WT, Tbx15+/− and Tbx15−/− EDL muscle. SDH pictures are taken at × 20. Scale bar, 100 μM. Myosin immunofluorescence pictures are taken at × 10. Scale bar, 200 μM. (d) Quantitation of glycolytic and oxidative muscle fibres from the rectus femoris quadriceps muscle of male WT, Tbx15+/− and Tbx15−/− mice at 6–8 weeks of age. Data are shown as mean±s.e.m. of three to eight animals per group. (e) Quantitation of fibre types from the EDL muscle of male WT, Tbx15+/− and Tbx15−/− mice at 6–8 weeks of age. Data are shown as mean±s.e.m. of three to four muscles per group. (f) Representative recordings of single-twitch contraction and tetanic stimulation of EDL fibre bundles from WT and Tbx15−/− mice at 3–4 months of age (n=8–10).
Figure 3
Figure 3. Tbx15+/− males are resistant to high-fat diet-induced obesity.
(a) Body weights of Tbx15+/− and control males during 10 weeks on high-fat diet or chow diet (started at 6 weeks of age). Data are shown as mean±s.e.m. of 10–12 animals per group. (b) Glucose tolerance testing of 5-month-old Tbx15+/− and control males. Data are shown as mean±s.e.m. of 10–12 animals per group (*P<0.05 for all panels by Student's t-test or Mann–Whitney U statistical tests). (c) Lean and fat mass from 6-month-old Tbx15+/− and control males. Data are shown as mean±s.e.m. of six to seven animals per group. (d) Triglyceride quantitation from liver and muscle extracts of 6-month-old Tbx15+/− and control males. Data are shown as mean±s.e.m. of six animals per group. (e) Haematoxylin and eosin staining (left panels) and Oil Red O staining (right panels) of 6–month-old Tbx15+/− and control livers. Nuclei are counterstained with haematoxylin. Representative digital images (× 20) are shown. Scale bar, 200 μM. (f) Spontaneous activity the light and dark cycles of pads from 5-month-old Tbx15+/− and control males. Data are shown as mean±s.e.m. of six animals per group.
Figure 4
Figure 4. Tbx15 regulates oxidative capacity and AMPK signalling in skeletal muscle.
(a) Expression of Tbx15 mRNA and protein were compared by qPCR and western blot analysis between C2C12 myoblasts stably transfected with shTbx15 or shGFP (control), and C2C12 myoblasts stably transfected with pBABE-Tbx15 or pBABE-Empty (control). Data shown as mean±s.e.m. of three independently transfected samples and was repeated three times. Western blot of Tbx15 from protein extracts from the same cells. Western blot for tubulin was used as a loading control (*P<0.05; **P<0.01; ***P<0.001 for all panels by Student's t-test). (b) Western blot analysis of phosphorylation of AMP kinase (AMPK) at Thr172 and acetyl-CoA carboxylase (ACC) at Ser79 and total protein controls from myoblasts stably transfected with shTbx15 or controls. Actin is used as a loading control. (c) Western blot analysis of phosphorylation of AMPK at Thr172 and Acc1 at Ser79 and total protein controls from skeletal muscle of 6-week-old Tbx15+/− and control males. Tubulin is used as a loading control. (d) Basal respiration of shTbx15, pBABE-Tbx15 and control C2C12 myoblasts was determined by calculating the area under the curve (AUC) during measurements of basal respiration. Values are means±s.e.m. of six to seven replicates. The whole experiment was repeated three times. (e) Western blot analysis of phosphorylation of AKT, ERK, mTOR, and p70SK1 and total protein controls from tibealas anterior of in 10-week-old Tbx15+/− and control male mice 5 U of insulin was injected per mouse and tissues were collected 15 min later. (f) Quantitation of western blots of phosphorylation of mTOR, and p70SK1 and total protein controls in Supplementary Fig. 4a. Values are means±s.e.m. of six to seven replicates.
Figure 5
Figure 5. Tbx15 regulates Igf2 and is critical for myotube formation.
(a) Expression level of Igf2 mRNA assessed by qPCR in C2C12 myoblasts stably transfected with pBABE-Tbx15 and pBABE-Empty (control), and C2C12 myoblasts stably transfected with shTbx15 and shGFP (control). Data shown as the means±s.e.m.'s of three independently transfected samples (*P<0.05 for all panels by Student's t-test). (b) Phalloidin-Alexa-546 staining of shTbx15 and shGFP (control) myotubes after 4 days of differentiation either treated with vehicle (0.1% BSA) or 10 ng ml−1 recombinant Igf2. Pictures were taken at × 10 magnification. Scale bar, 50 μM. (c) Expression level of Igf2, MyoD, Myf5 and myogenin mRNA was assessed by qPCR in C2C12 myoblasts stably transfected with shTbx15 and shGFP (control) myotubes after 4 days of differentiation. Data are shown as mean±s.e.m. of three independently transfected samples. The experiment was repeated three times. (d) Immunofluorescence staining for total myosin isoforms (left) and Igf2 (right) from developing muscles in the limb buds of wild-type (WT) and Tbx15−/− E14.5 embryos. Pictures are taken at × 20 magnification. Scale bar, 100 μM. (e) Expression level of Igf2 mRNA was compared by qPCR in dissected limb muscle from WT, Tbx15+/− and Tbx15−/− E14.5 embryos and from tibialis anterior skeletal muscle from at WT and Tbx15−/− male mice at p28. Values are means±s.e.m. of four to six animals per group. (f) Succinate dehydrogenase (SDH) staining of tibialis anterior muscle from 8-week-old WT and Igf2 knockout (n=3). Pictures were taken at × 20. Scale bar, 50 μM. (g) Model of Tbx15 action in skeletal muscle.

Similar articles

Cited by

References

    1. He J., Watkins S. & Kelley D. E. Skeletal muscle lipid content and oxidative enzyme activity in relation to muscle fiber type in type 2 diabetes and obesity. Diabetes 50, 817 (2001). - PubMed
    1. Hickey M. S. et al. Skeletal muscle fiber composition is related to adiposity and in vitro glucose transport rate in humans. Am. J. Physiol. 268, E453–E457 (1995). - PubMed
    1. Nyholm B. et al. Evidence of an increased number of type IIb muscle fibers in insulin-resistant first-degree relatives of patients with NIDDM. Diabetes 46, 1822 (1997). - PubMed
    1. Tanner C. J. et al. Muscle fiber type is associated with obesity and weight loss. Am. J. Physiol. Endocrinol. Metab. 282, E1191–E1196 (2002). - PubMed
    1. Marin P., Andersson B., Krotkiewski M. & Bjorntorp P. Muscle fiber composition and capillary density in women and men with NIDDM. Diabetes Care 17, 382 (1994). - PubMed

Publication types

MeSH terms

Associated data