. 2015 Oct;1849(10):1277-88.
doi: 10.1016/j.bbagrm.2015.08.004. Epub 2015 Aug 18.

Coordinated regulation of Nrf2 and histone H3 serine 10 phosphorylation in arsenite-activated transcription of the human heme oxygenase-1 gene

Affiliations

Coordinated regulation of Nrf2 and histone H3 serine 10 phosphorylation in arsenite-activated transcription of the human heme oxygenase-1 gene

Paul D Ray et al. Biochim Biophys Acta. 2015 Oct.

Abstract

Expression of the antioxidant gene heme oxygenase-1 (HO-1) is primarily induced through NF-E2-related factor 2 (Nrf2)-mediated activation of the antioxidant response element (ARE). Gene transcription is coordinately regulated by transcription factor activity at enhancer elements and epigenetic alterations such as the posttranslational modification of histone proteins. However, the role of histone modifications in the Nrf2-ARE axis remains largely uncharacterized. The environmental contaminant arsenite is a potent inducer of both HO-1 expression and phosphorylation of histone H3 serine 10 (H3S10); therefore, we investigated the relationships between Nrf2 and H3S10 phosphorylation in arsenite-induced, ARE-dependent, transcriptional activation of the human HO-1 gene. Arsenite increased phosphorylation of H3S10 both globally and at the HO-1 promoter concomitantly with HO-1 transcription in human HaCaT keratinocytes. Conversely, arsenite-induced H3S10 phosphorylation and HO-1 expression were blocked by N-acetylcysteine (NAC), the c-Jun N-terminal kinase (JNK) inhibitor SP600125, and JNK knockdown (siJNK). Interestingly, ablation of arsenite-induced H3S10 phosphorylation by SP600125 or siJNK did not inhibit Nrf2 nuclear accumulation nor ARE binding, despite inhibiting HO-1 expression. In response to arsenite, binding of Nrf2 to the HO-1 ARE preceded phosphorylation of H3S10 at the HO-1 ARE. Furthermore, arsenite-mediated occupancy of phosphorylated H3S10 at the HO-1 ARE was decreased in Nrf2-deficient mouse embryonic fibroblasts. These results suggest the involvement of H3S10 phosphorylation in the Nrf2-ARE axis by proposing that Nrf2 may influence H3S10 phosphorylation at the HO-1 ARE and additional promoter regions. Our data highlights the complex interplay between Nrf2 and H3S10 phosphorylation in arsenite-activated HO-1 transcription.

Keywords: Antioxidant response element; Arsenic; Epigenetic; HO-1; Histone; Nrf2.


Figures

Figure 1
Figure 1. Arsenite induces H3S10 phosphorylation and HO-1 expression
HaCaT cells were treated with 1, 5, 10, or 25µM arsenite for 8 hr (a and c), or alternatively treated with 10µM arsenite for 4, 8, 12, or 24 hr (b and d) and harvested as either whole cell lysate or total RNA. Whole cell lysates were subjected to Western blot analysis with anti-HO-1 and anti-H3S10 phospho-specific (H3S10-P) antibodies; β-Actin and histone H3 blots are shown as loading controls. 6 µg of total RNA was subjected to Northern blot analysis employing a 32P-labeled HO-1 cDNA probe; ethidium bromide staining of total RNA is shown to verify equal loading and positions of 18 and 28S ribosomal RNA are indicated. Quantification of blots is shown to the right. Densitometry analysis was conducted with Image J software. Relative density of arsenite treated signal bands were normalized to the corresponding control signal bands for fold change, then further normalized to the relative density of loading control signal bands for loading accuracy. For HO-1 protein blots, β-Actin signals were used for normalization, while for H3S10-P, the average relative density of β-Actin and histone H3 signal bands were used. The 28s rRNA band was used for normalization of the HO-1 mRNA signal bands.
Figure 2
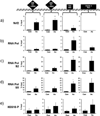
Figure 2. Arsenite induces H3S10 phosphorylation and transcriptional activation of the HO-1 gene
HaCaT cells were treated with 10µM arsenite for 4 hr, then harvested for chromatin immunoprecipitation (ChIP) and incubated with rabbit IgG, anti-Nrf2 (a), anti-RNA Pol II (b), anti-phospho-RNAPol S2 (c), anti-phospho RNAPol S5 (d), or anti-H3S10 phospho-specific (H3S10-P) (e) antibody as described in Materials and Methods. Isolated genomic DNA was subjected to quantitative RT-PCR using primer pairs for the HO-1 E2, E1, TSS, and Exon 3 regions. Samples were normalized to input and presented as percent input. Significance was calculated using a t-test and established with p < 0.05 (*) or p < 0.01 (**). A representative of four independent experiments is shown.
Figure 3
Figure 3. Arsenite induces H3S10 phosphorylation and HO-1 expression through oxidative stress-dependent mechanisms
(a) HaCaT cells were treated with 10µM arsenite for 2, 4, and 6 hr, and then analyzed for total cellular ROS production by CM-H2DCF-DA assay. Fluorescence levels of control cells without arsenite treatment (0) was defined as 1. Significance was calculated using a t-test and established with p < 0.05. Results are means ± SE of 4 independents experiments. (b) HaCaT cells were pretreated with 10mM NAC for 1 hr, then treated with 10 or 30µM arsenite for 8 hr and harvested as whole cell lysates or total RNA. Whole cell lysates were subjected to Western blot analysis with anti-HO-1 and anti-H3S10 phospho-specific (H3S10-P) antibodies; histone H3 blot is shown as loading control. 5 µg of total RNA was subjected to Northern blot analysis employing a 32P-labeled HO-1 cDNA probe; ethidium bromide staining of total RNA is shown to verify equal loading and positions of 18 and 28S ribosomal RNA are indicated. (c) In the same condition as (b), nuclear and cytoplasmic extracts were prepared and subjected to Western blot analysis with anti-Nrf2 specific antibody. Quantification of blots in b) and c) is shown to the right. Densitometry analysis was conducted with Image J software. Relative density of arsenite and NAC treated signal bands were normalized to the corresponding control signal bands for fold change, then further normalized to the relative density of loading control signal bands for loading accuracy. For HO-1 and H3S10-P protein blots, H3 signals were used for normalization. The 28s rRNA band was used for normalization of the HO-1 mRNA signal bands. (d & e) HaCaT cells were pretreated with 10mM NAC for 1 hr, then treated with 10µM arsenite for 4 hr and harvested for chromatin immunoprecipitation (ChIP) and incubated with rabbit IgG, anti-H3S10 phospho-specific (H3S10-P), or anti-Nrf2 antibody. Isolated genomic DNA was subjected to quantitative RT-PCR using primer pairs for the HO-1 E1 (d) and TSS (e) regions. Samples were normalized to input and presented as percent input. Significance was calculated using a t-test and established with p < 0.05. A representative of three independent experiments is shown.
Figure 4
Figure 4. Induction of H3S10 phosphorylation and HO-1 by arsenite is MAPK-dependent
(a) HaCaT cells were treated with 10µM arsenite for 1, 2, 6, or 12 hr and harvested as whole cell lysate and subjected to Western blot analysis with anti-phospho p38 (T180/Y182), anti-phospho ERK (T202/Y204), and anti-phospho JNK (T183/Y185) specific antibodies. (b) HaCaT cells were pretreated with 10µM SB203580, U0126, or SP600125 for 1 hr, then treated with 10µM arsenite for 8 hr. Whole cell lysates were subjected to Western blot analysis with anti-H3S10 phospho-specific antibody; histone H3 blot is shown as loading control. (c) HaCaT cells were pretreated with 10µM SP600125 for 1 hr, then treated with 10µM arsenite for 8 hr and harvested as whole cell lysates or total RNA. Whole cell lysates were subjected to Western blot analysis with anti-HO-1 and anti-H3S10 phospho-specific antibodies; lactate dehydrogenase (LDH) blot is shown as loading control. 7 µg of total RNA was subjected to Northern blot analysis employing a 32P-labeled HO-1 cDNA probe; ethidium bromide staining of total RNA is shown to verify equal loading and positions of 18 and 28S ribosomal RNA are indicated. Quantification of blots is shown to the right. Densitometry analysis was conducted with Image J software. Relative density of arsenite and SP600125 treated signal bands were normalized to the corresponding control signal bands for fold change, then further normalized to the relative density of loading control signal bands for loading accuracy. β-Actin, H3, and LDH signals were used for protein normalization. The 28s rRNA band was used for normalization of the HO-1 mRNA signal bands.
Figure 5
Figure 5. SP600125 inhibits enrichment of phosphorylated H3S10 but not Nrf2 on the HO-1 ARE in response to arsenite
(a) HaCaT cells were pretreated with 10µM SP600125 for 1 hr, then treated with 10µM arsenite for 4 hr and harvested as cytoplasmic and nuclear fractions and subjected to Western blot analysis with anti-Nrf2 specific antibodies; Lamin B blot is shown as loading control. Quantification of blots is shown to the right. Densitometry analysis was conducted with Image J software. Relative density of arsenite and SP600125 treated signal bands were normalized to the corresponding control signal bands for fold change, then further normalized to the relative density of Lamin B signal bands for loading accuracy. (b and c) HaCaT cells were pretreated with 10µM SP600125 for 1 hr, then treated with 10µM arsenite for 4 hr, harvested for chromatin immunoprecipitation (ChIP) and incubated with rabbit IgG, anti-H3S10 phospho-specific (H3S10-P), or anti-Nrf2 antibody. Isolated genomic DNA was subjected to quantitative RT-PCR using primer pairs for the HO-1 E1 (b) and TSS (c) regions. Samples were normalized to input and presented as percent input. Significance was calculated using a t-test and established with p < 0.05 (*) or p < 0.01 (**). A representative of three independent experiments is shown.
Figure 6
Figure 6. Arsenite induces JNK-dependent H3S10 phosphorylation and recruits Nrf2 to the HO-1 ARE prior to enrichment of phosphorylated H3S10
a) HaCaT cells were transiently transfected with JNK specific siRNA or control siRNA as described in Materials and Methods. After 48 hr, cells were treated with 10µM arsenite for 8 hr and nuclear and cytoplasmic fractions were subjected to Western blot analysis with anti-HO-1, anti-Nrf2, anti-JNK, and anti-H3S10 phospho-specific (H3S10-P) antibodies; Lamin B and β-Actin blots are shown as loading controls. Quantification of blots is shown to the right. Densitometry analysis was conducted with Image J software. Relative density of arsenite treated signal bands were normalized to the corresponding control signal bands (siCon/arsenite (−)) for fold change, then further normalized to the relative density of loading control signal bands for loading accuracy; JNK and HO-1 were normalized to β-Actin; H3S10-P and Nrf2 were normalized to Lamin B. (b and c) HaCaT cells were treated with 10µM arsenite for 0.5, 1, 2, or 4 hr, then harvested for ChIP assay and incubated with rabbit IgG, anti-Nrf2 (b), or anti-H3S10 phospho-specific (H3S10-P) (c) antibody. Isolated genomic DNA was subjected to quantitative RT-PCR using primer pairs for the HO-1 E1 region. Samples were normalized to input and presented as percent input. Significance was calculated using a t-test and established with p < 0.05. A representative of three independent experiments is shown. (d) Graphical representation of temporal induction of Nrf2 and phosphorylated H3S10 (H3S10-P) enrichment on the HO-1 E1 ARE.
Figure 7
Figure 7. Nrf2 is associated with phosphorylation of H3S10 on the mouse Ho-1 ARE
a) Nrf2 +/+ and Nrf2 −/− MEF cells were treated with 10µM arsenite for 8 hr and nuclear and cytoplasmic fractions were subjected to Western blot analysis with anti-HO-1, anti-Nrf2, and anti-H3S10 phospho-specific (H3S10-P) antibodies; Lamin B, histone H3, and β-Actin blots are shown as loading controls. Quantification of blots is shown to the right. Densitometry analysis was conducted with Image J software. Relative density of arsenite treated signal bands were normalized to the corresponding control signal bands (Nrf2+/+, arsenite (−)) for fold change, then further normalized to the relative density of loading control signal bands for loading accuracy; HO-1 was normalized to β-Actin; Nrf2 was normalized to Lamin B, and H3S10-P was normalized to H3. (b and c) Nrf2 +/+ and Nrf2 −/− MEF cells were treated with 10µM arsenite for 4 hr, harvested for ChIP assay, and incubated with rabbit IgG, (b) anti-Nrf2, or anti-H3S10 phospho-specific (H3S10-P) antibody. Isolated genomic DNA was subjected to quantitative RT-PCR using primer pairs for the mouse HO-1 E1 region. Samples were normalized to input and presented as percent input. Significance was calculated using a t-test and established with p < 0.05. A representative of three independent experiments is shown.

Similar articles

Cited by

References

    1. Naujokas MF, Anderson B, Ahsan H, Aposhian HV, Graziano JH, Thompson C, Suk WA. The broad scope of health effects from chronic arsenic exposure: update on a worldwide public health problem. Environ Health Perspect. 2013;121:295–302. - PMC - PubMed
    1. Jomova K, Jenisova Z, Feszterova M, Baros S, Liska J, Hudecova D, Rhodes CJ, Valko M. Arsenic: toxicity, oxidative stress and human disease. Journal of applied toxicology : J. Appl. Tox. 2011;31:95–107. - PubMed
    1. Huang C, Ke Q, Costa M, Shi X. Molecular mechanisms of arsenic carcinogenesis. Mol Cell Biochem. 2004;255:57–66. - PubMed
    1. Shi H, Hudson LG, Ding W, Wang S, Cooper KL, Liu S, Chen Y, Shi X, Liu KJ. Arsenite causes DNA damage in keratinocytes via generation of hydroxyl radicals. Chem Res Toxicol. 2004;17:871–878. - PubMed
    1. Ray PD, Huang BW, Tsuji Y. Reactive oxygen species (ROS) homeostasis and redox regulation in cellular signaling. Cell Signal. 2012;24:981–990. - PMC - PubMed

Publication types

MeSH terms