Integrated Model of Chemical Perturbations of a Biological Pathway Using 18 In Vitro High-Throughput Screening Assays for the Estrogen Receptor
- PMID: 26272952
- PMCID: PMC4635633
- DOI: 10.1093/toxsci/kfv168
Integrated Model of Chemical Perturbations of a Biological Pathway Using 18 In Vitro High-Throughput Screening Assays for the Estrogen Receptor
Abstract
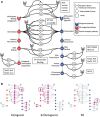
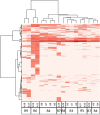
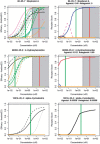
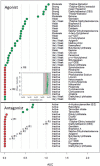
We demonstrate a computational network model that integrates 18 in vitro, high-throughput screening assays measuring estrogen receptor (ER) binding, dimerization, chromatin binding, transcriptional activation, and ER-dependent cell proliferation. The network model uses activity patterns across the in vitro assays to predict whether a chemical is an ER agonist or antagonist, or is otherwise influencing the assays through a manner dependent on the physics and chemistry of the technology platform ("assay interference"). The method is applied to a library of 1812 commercial and environmental chemicals, including 45 ER positive and negative reference chemicals. Among the reference chemicals, the network model correctly identified the agonists and antagonists with the exception of very weak compounds whose activity was outside the concentration range tested. The model agonist score also correlated with the expected potency class of the active reference chemicals. Of the 1812 chemicals evaluated, 111 (6.1%) were predicted to be strongly ER active in agonist or antagonist mode. This dataset and model were also used to begin a systematic investigation of assay interference. The most prominent cause of false-positive activity (activity in an assay that is likely not due to interaction of the chemical with ER) is cytotoxicity. The model provides the ability to prioritize a large set of important environmental chemicals with human exposure potential for additional in vivo endocrine testing. Finally, this model is generalizable to any molecular pathway for which there are multiple upstream and downstream assays available.
Keywords: EDSP; In vitro; biological modeling; estrogen receptor; high-throughput screening; prioritization.
Published by Oxford University Press on behalf of the Society of Toxicology 2015. This work is written by US Government employees and is in the public domain in the US.
Figures


Similar articles
-
Identification of putative estrogen receptor-mediated endocrine disrupting chemicals using QSAR- and structure-based virtual screening approaches.Toxicol Appl Pharmacol. 2013 Oct 1;272(1):67-76. doi: 10.1016/j.taap.2013.04.032. Epub 2013 May 23. Toxicol Appl Pharmacol. 2013. PMID: 23707773 Free PMC article.
-
Development of a recombinant human ovarian (BG1) cell line containing estrogen receptor α and β for improved detection of estrogenic/antiestrogenic chemicals.Environ Toxicol Chem. 2016 Jan;35(1):91-100. doi: 10.1002/etc.3146. Epub 2015 Dec 9. Environ Toxicol Chem. 2016. PMID: 26139245 Free PMC article.
-
Predictive endocrine testing in the 21st century using in vitro assays of estrogen receptor signaling responses.Environ Sci Technol. 2014;48(15):8706-16. doi: 10.1021/es502676e. Epub 2014 Jul 10. Environ Sci Technol. 2014. PMID: 24960280
-
Xenoestrogens: mechanisms of action and some detection studies.Pol J Vet Sci. 2008;11(3):263-9. Pol J Vet Sci. 2008. PMID: 18942551 Review.
-
Endocrine disruptors: can biological effects and environmental risks be predicted?Regul Toxicol Pharmacol. 2002 Aug;36(1):118-30. doi: 10.1006/rtph.2002.1564. Regul Toxicol Pharmacol. 2002. PMID: 12383724 Review.
Cited by
-
Selecting a minimal set of androgen receptor assays for screening chemicals.Regul Toxicol Pharmacol. 2020 Nov;117:104764. doi: 10.1016/j.yrtph.2020.104764. Epub 2020 Aug 14. Regul Toxicol Pharmacol. 2020. PMID: 32798611 Free PMC article.
-
A cross-platform approach to characterize and screen potential neurovascular unit toxicants.Reprod Toxicol. 2020 Sep;96:300-315. doi: 10.1016/j.reprotox.2020.06.010. Epub 2020 Jun 24. Reprod Toxicol. 2020. PMID: 32590145 Free PMC article.
-
AOP Report: Adverse Outcome Pathways for Aromatase Inhibition or Androgen Receptor Agonism Leading to Male-Biased Sex Ratio and Population Decline in Fish.Environ Toxicol Chem. 2023 Apr;42(4):747-756. doi: 10.1002/etc.5581. Epub 2023 Mar 14. Environ Toxicol Chem. 2023. PMID: 36848318 Free PMC article.
-
Progress in data interoperability to support computational toxicology and chemical safety evaluation.Toxicol Appl Pharmacol. 2019 Oct 1;380:114707. doi: 10.1016/j.taap.2019.114707. Epub 2019 Aug 9. Toxicol Appl Pharmacol. 2019. PMID: 31404555 Free PMC article. Review.
-
Consensus on the key characteristics of endocrine-disrupting chemicals as a basis for hazard identification.Nat Rev Endocrinol. 2020 Jan;16(1):45-57. doi: 10.1038/s41574-019-0273-8. Epub 2019 Nov 12. Nat Rev Endocrinol. 2020. PMID: 31719706 Free PMC article. Review.
References
-
- Akaike H. (1998). Information Theory and an Extension of the Maximum Liklihood Principle. Springer, New York, NY.
-
- Baell J. B., Holloway G. A. (2010). New substructure filters for removal of pan assay interference compounds (PAINS) from screening libraries and for their exclusion in bioassays. J. Med. Chem. 53, 2719–2740. - PubMed
-
- Browne P., Judson R. S., Casey W. M., Kleinstreuer N. C., Thomas R. S. (2015). Screening chemicals for estrogen receptor bioactivity using a computational model. Environ Sci. Technol. 49, 8804–8814. - PubMed
-
- Bruns R. F., Watson I. A. (2012). Rules for identifying potentially reactive or promiscuous compounds. J. Med. Chem., 55, 9763–9772. - PubMed
Publication types
MeSH terms
Substances
LinkOut - more resources
Full Text Sources
Other Literature Sources
Miscellaneous

