. 2015;10(10):931-42.
doi: 10.1080/15592294.2015.1081327.

Antagonist Xist and Tsix co-transcription during mouse oogenesis and maternal Xist expression during pre-implantation development calls into question the nature of the maternal imprint on the X chromosome

Affiliations

Antagonist Xist and Tsix co-transcription during mouse oogenesis and maternal Xist expression during pre-implantation development calls into question the nature of the maternal imprint on the X chromosome

Jane Lynda Deuve et al. Epigenetics. 2015.

Abstract

During the first divisions of the female mouse embryo, the paternal X-chromosome is coated by Xist non-coding RNA and gradually silenced. This imprinted X-inactivation principally results from the apposition, during oocyte growth, of an imprint on the X-inactivation master control region: the X-inactivation center (Xic). This maternal imprint of yet unknown nature is thought to prevent Xist upregulation from the maternal X (X(M)) during early female development. In order to provide further insight into the X(M) imprinting mechanism, we applied single-cell approaches to oocytes and pre-implantation embryos at different stages of development to analyze the expression of candidate genes within the Xic. We show that, unlike the situation pertaining in most other cellular contexts, in early-growing oocytes, Xist and Tsix sense and antisense transcription occur simultaneously from the same chromosome. Additionally, during early development, Xist appears to be transiently transcribed from the X(M) in some blastomeres of late 2-cell embryos concomitant with the general activation of the genome indicating that X(M) imprinting does not completely suppress maternal Xist transcription during embryo cleavage stages. These unexpected transcriptional regulations of the Xist locus call for a re-evaluation of the early functioning of the maternal imprint on the X-chromosome and suggest that Xist/Tsix antagonist transcriptional activities may participate in imprinting the maternal locus as described at other loci subject to parental imprinting.

Keywords: X-inactivation; imprinting; long non-coding RNAs; mouse oogenesis; mouse pre-implantation development; single-cell analysis; transcription.


Figures

Figure 1.
Figure 1.
High transcriptional activities within the Xic in early-growing oocytes. (A) Xic map showing the non-coding genes in orange, the non-coding transcription units in hatched orange, and the coding genes in gray. The imprint candidate region described in is indicated. (B) Diagram representing the main phases of oogenesis. As early as E13.5, meiosis starts in primordial germ cells. Oocytes are arrested in prophase I at E18 (MI oocytes). Shortly after the birth of female mice, the primary oocytes are incorporated into primordial follicles. Upon follicle recruitment, such primary oocytes enter a growth phase to become fully-grown, GV-stage oocytes reaching prophase I (2n chromosomes, 4c chromatids). At puberty, the induction of ovulation leads to the breakdown of the germinal vesicle (or nuclear membrane), the resumption of meiosis associated with expulsion of the first polar body until the second metaphase (MII oocytes). The mature oocyte (1n, 2c) is then ready to be fertilized. During oocyte growth phase, the volume of the oocyte increases to reach 4-5 times its initial size. At 12 dpp the oocyte population of the ovary consists in a mixture of early-growing and late-growing oocytes that have been identified using a size-based criterion. Ovaries from older (3 to 6-week-old) mice have been used to obtain late-growing oocytes. SN oocytes have been separated from NSN by Hoechst staining. (C) Heatmap showing the levels of primary transcripts both within the Xic, at several X-linked genes and at lncRNAs of imprinted gene clusters in a population of early-growing MI (7), NSN (14) and SN (8) late-growing MI and MII (20) oocytes (129Sv mouse strain). Intronic assays have been used to quantify the primary transcription of coding genes and of lncRNAs when applicable (see Table S1 for primer sequence). For each gene, absolute pre-RNA levels have been normalized by the mean and by the variance across the cell population. The levels of primary transcripts in early-growing oocytes are significantly different from corresponding RNA levels in late-growing MI and MII oocytes (t-test q-value < 10−3). Steady-state levels of 3 housekeeping RNAs (Gapdh, Rplp0, and Hist2h2a), measured using exonic assays, are shown as a control of RNA quality. See also hierarchical clustering of expression profiles and oocyte quality controls in Figure S2. (D) Histograms showing the absolute RNA levels measured using single-cell RT-qPCR at the indicated position in oocytes at different stages. The horizontal dotted line on the histogram marks the average level of spliced Xist RNA on the inactive X-chromosome in female somatic cells. Above the histograms, the map shows the reciprocal structures of the Xist and Tsix transcripts. The majority of Tsix transcription initiates upstream of the DXPas34 minisatellite. The positions of the RT-qPCR assays used to detect Tsix transcription (Tsix) and primary/spliced Xist transcripts (Xist IN/Xist Trans-EX) are shown as solid bars above and underneath the map respectively. Exons: solid gray boxes; DXPas34: open gray box.
Figure 2:.
Figure 2:.
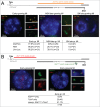
Transcription and nuclear organization of Xic transcripts in early-growing MI oocytes and in late-growing NSN and SN MI oocytes (129Sv). (A) Representative images showing the maximal projections of early-growing MI oocytes, and late growing MI oocytes showing either an NSN or an SN chromatin conformation after RNA-FISH for Xist/Tsix, for Rlim and for the Linx locus. Probes used for hybridization are indicated on each image. The position of the double-stranded probe detecting both Xist and Tsix (orange) is shown on the map above the pictures. Magnifications of the nuclear area around the signals are shown. The table underneath the pictures shows the percentage of oocyte showing an RNA-FISH signal at the indicated locus for each category of oocytes. (B) Transcription at the Xist/Tsix locus analyzed in RNA-FISH using a double-stranded Tsix specific probe (red) and a single-stranded Xist specific fluorescent oligonucleotide (green) located within Xist repeat C . Images of 2 different early-growing oocytes are shown together with magnifications of nuclear area around the signals. The position of the probes used in this panel is shown on the map above the pictures. The table underneath the RNA-FISH images indicates the percentage of early-growing oocytes showing Xist or Tsix transcription only, or showing simultaneous Xist and Tsix transcription from at least 1 chromatid.
Figure 3.
Figure 3.
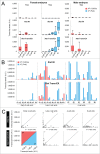
Allele-specific RT-qPCR analysis of transcription at the Xist/Tsix locus in 129Sv/Pwk pre-implantation embryos. (A) Box-plots showing the distribution of transcript levels in whole female and male embryos obtained from a 129Sv × Pwk cross assessed by RT-qPCR using the Biomark technology. Tsix, Xist IN, and Xist Trans-EX PCR assays are the same as in Figure 1C except that allelic assays have been used here (see Table S1 for primer sequence). Z: zygotes (female, n = 10; male, n = 4); 2-cell (E): early 2-cell embryos (female, n = 5; male, n = 4); 2-cell (L): late 2-cell embryos (female, n = 4; male, n = 4); 4-cell: 4-cell embryos (female, n = 5; male, n = 6); 8-cell: 8-cell embryos (female, n = 7; male n = 10); M: morulae (female, n = 6; male, n = 7). See Materials and Methods section for embryo sexing. The levels of maternal Xist transcripts in late 2-cell embryos are significantly different from the levels of maternal Xist transcripts in early 2-cell or in 4-cell embryos in both male and female (P <0.05 by KS test). Only embryos showing significant expression of reporter housekeeping genes Gapdh, Rplp0, and Hist2h2a are shown. (B) Cumulative histograms showing the relative amounts of paternal (blue) and maternal (red) transcripts in dissociated cells of 129Sv/Pwk female embryos at the indicated stage assessed using single-cell allelic RT-qPCR. A representative selection of results is shown (see Table S3 and panel C for complete results). Only embryos showing significant expression of reporter housekeeping genes Gapdh, Rplp0, and Hist2h2a in all blastomeres are shown. (C) Scatter-plots of expression levels from the paternal (x-axis) relative to the maternal (y-axis) X chromosome measured with the indicated RT-qPCR assay in individual cells of embryos at the indicated pre-implantation stage. Each dot represents a cell. A significant difference in Xist expression from the XM is detected with both Xist IN and Xist trans-EX in cells of late 2-cell embryos as compared to cells of embryos at either earlier or later stages of development (P <0.05 by KS test). Only blastomeres showing significant expression of reporter housekeeping genes Gapdh, Rplp0, and Hist2h2a are shown.
Figure 4.
Figure 4.
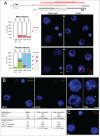
In situ transcription and nuclear organization of Xist ncRNAs during pre-implantation development. (A) Representative images showing the maximal projections of male and female late 2-cell and 4-cell embryos (129Sv/Pwk) after RNA-FISH for Xist/Tsix, for Rlim and for Kdm5c. Bar scale = 5 μm. Histograms on the left show the percentages of nuclei displaying the indicated RNA-FISH profile. The number of cells analyzed and, in brackets, the corresponding number of embryos is indicated above each column. Above, the map shows the position of RNA-FISH probes used in panel A and B. (B) Transcription at the Xist/Tsix locus analyzed in RNA-FISH using single-stranded Tsix specific fluorescent oligonucleotides (yellow, Tsixantisense) and single-stranded Xist specific fluorescent oligonucleotides (green, Xistsense2) located within Xist introns (see map in panel A). Representative images showing the maximal projections of a female late 2-cell embryo (129Sv/129Sv-GFP) after RNA-FISH (left) and after sequential DNA-FISH for the Xic (red) and for the GFP transgene (green) are shown. Magnifications of each nucleus are shown on the right of embryo images. The arrowheads indicate the location of the DNA-FISH signals. Bar scale = 5 μm. The table underneath the images indicates the percentages of zygotes, early 2-cell and late 2-cell embryos showing the indicated expression profile at the Xist locus. The table shows pooled results from C57BL/6 × 129Sv cross and from Pwk × 129Sv-GFP cross. No significant difference was observed between the 2 crosses. (C) Example of scattered Xist RNA signals observed in 27.3 % of late 2-cell embryos (n = 21 embryos) with Xistsense2 (green). Signal from the green channel has been amplified to allow visualization of the faint scattered dots.

Similar articles

Cited by

References

    1. Kay GF, Barton SC, Surani MA, Rastan S. Imprinting and X chromosome counting mechanisms determine Xist expression in early mouse development. Cell 1994; 77:639-50; PMID:8205614; http://dx.doi.org/10.1016/0092-8674(94)90049-3 - DOI - PubMed
    1. Matsui J, Goto Y, Takagi N. Control of Xist expression for imprinted and random X chromosome inactivation in mice. Hum Mol Genet 2001; 10:1393-401; PMID:11440992; http://dx.doi.org/10.1093/hmg/10.13.1393 - DOI - PubMed
    1. Zuccotti M, Boiani M, Ponce R, Guizzardi S, Scandroglio R, Garagna S, Redi CA. Mouse Xist expression begins at zygotic genome activation and is timed by a zygotic clock. Mol Reprod Dev 2002; 61:14-20; PMID:11774371; http://dx.doi.org/10.1002/mrd.1126 - DOI - PubMed
    1. Nesterova TB, Barton SC, Surani MA, Brockdorff N. Loss of Xist imprinting in diploid parthenogenetic preimplantation embryos. Dev Biol 2001; 235:343-50; PMID:11437441; http://dx.doi.org/10.1006/dbio.2001.0295 - DOI - PubMed
    1. Okamoto I, Tan S, Takagi N. X-chromosome inactivation in XX androgenetic mouse embryos surviving implantation. Development 2000; 127:4137-45; PMID:10976046 - PubMed

Publication types

LinkOut - more resources