Permutation and parametric tests for effect sizes in voxel-based morphometry of gray matter volume in brain structural MRI
- PMID: 26253778
- PMCID: PMC4658290
- DOI: 10.1016/j.mri.2015.07.014
Permutation and parametric tests for effect sizes in voxel-based morphometry of gray matter volume in brain structural MRI
Abstract
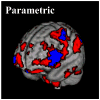
Permutation testing has been widely implemented in voxel-based morphometry (VBM) tools. However, this type of non-parametric inference has yet to be thoroughly compared with traditional parametric inference in VBM studies of brain structure. Here we compare both types of inference and investigate what influence the number of permutations in permutation testing has on results in an exemplar study of how gray matter proportion changes with age in a group of working age adults. High resolution T1-weighted volume scans were acquired from 80 healthy adults aged 25-64years. Using a validated VBM procedure and voxel-based permutation testing for Pearson product-moment coefficient, the effect sizes of changes in gray matter proportion with age were assessed using traditional parametric and permutation testing inference with 100, 500, 1000, 5000, 10000 and 20000 permutations. The statistical significance was set at P<0.05 and false discovery rate (FDR) was used to correct for multiple comparisons. Clusters of voxels with statistically significant (PFDR<0.05) declines in gray matter proportion with age identified with permutation testing inference (N≈6000) were approximately twice the size of those identified with parametric inference (N=3221voxels). Permutation testing with 10000 (N=6251voxels) and 20000 (N=6233voxels) permutations produced clusters that were generally consistent with each other. However, with 1000 permutations there were approximately 20% more statistically significant voxels (N=7117voxels) than with ≥10000 permutations. Permutation testing inference may provide a more sensitive method than traditional parametric inference for identifying age-related differences in gray matter proportion. Based on the results reported here, at least 10000 permutations should be used in future univariate VBM studies investigating age related changes in gray matter to avoid potential false findings. Additional studies using permutation testing in large imaging databanks are required to address the impact of model complexity, multivariate analysis, number of observations, sampling bias and data quality on the accuracy with which subtle differences in brain structure associated with normal aging can be identified.
Keywords: Aging; Brain structure; Gray matter; Magnetic resonance imaging; Statistical inference.
Copyright © 2015 Elsevier Inc. All rights reserved.
Figures


Similar articles
-
Voxel-based morphometric analysis of gray matter in first episode schizophrenia.Neuroimage. 2002 Dec;17(4):1711-9. doi: 10.1006/nimg.2002.1296. Neuroimage. 2002. PMID: 12498745 Free PMC article.
-
A Cross-Sectional Voxel-Based Morphometric Study of Age- and Sex-Related Changes in Gray Matter Volume in the Normal Aging Brain.J Comput Assist Tomogr. 2016 Mar-Apr;40(2):307-15. doi: 10.1097/RCT.0000000000000351. J Comput Assist Tomogr. 2016. PMID: 26983072
-
Influence of parameter settings in voxel-based morphometry 8. Using DARTEL and region-of-interest on reproducibility in gray matter volumetry.Methods Inf Med. 2015;54(2):171-8. doi: 10.3414/ME14-01-0049. Epub 2014 Oct 27. Methods Inf Med. 2015. PMID: 25345402
-
A methodological assessment of studies that use voxel-based morphometry to study neural changes in tinnitus patients.Hear Res. 2017 Nov;355:23-32. doi: 10.1016/j.heares.2017.09.002. Epub 2017 Sep 11. Hear Res. 2017. PMID: 28951023 Free PMC article. Review.
-
[Understanding Voxel-Based Morphometry].Brain Nerve. 2017 May;69(5):505-511. doi: 10.11477/mf.1416200776. Brain Nerve. 2017. PMID: 28479527 Review. Japanese.
Cited by
-
Impact of Zika Virus on adult human brain structure and functional organization.Ann Clin Transl Neurol. 2018 May 16;5(6):752-762. doi: 10.1002/acn3.575. eCollection 2018 Jun. Ann Clin Transl Neurol. 2018. PMID: 29928658 Free PMC article.
-
Covarying structural alterations in laterality of the temporal lobe in schizophrenia: A case for source-based laterality.NMR Biomed. 2020 Jun;33(6):e4294. doi: 10.1002/nbm.4294. Epub 2020 Mar 23. NMR Biomed. 2020. PMID: 32207187 Free PMC article.
-
Inter-brain coupling reflects disciplinary differences in real-world classroom learning.NPJ Sci Learn. 2023 May 2;8(1):11. doi: 10.1038/s41539-023-00162-1. NPJ Sci Learn. 2023. PMID: 37130852 Free PMC article.
-
Scanning ultrasound-mediated memory and functional improvements do not require amyloid-β reduction.Mol Psychiatry. 2024 Aug;29(8):2408-2423. doi: 10.1038/s41380-024-02509-5. Epub 2024 Mar 18. Mol Psychiatry. 2024. PMID: 38499653 Free PMC article.
-
A roadmap of brain recovery in a mouse model of concussion: insights from neuroimaging.Acta Neuropathol Commun. 2021 Jan 6;9(1):2. doi: 10.1186/s40478-020-01098-y. Acta Neuropathol Commun. 2021. PMID: 33407949 Free PMC article.
References
-
- Ashburner J, Friston K. Voxel-Based Morphometry The Methods. Neuroimage. 2000;11:805–821. - PubMed
-
- Good CD, Johnsrude IS, Ashburner J, Henson RNA, Friston KJ, Frackowiak RSJ. A voxel-based morphometric study of ageing in 465 normal adult human brains. Neuroimage. 2001;14:21–36. - PubMed
-
- Salmond CH, Ashburner J, Vargha-Khadem F, Connelly A, Gadian DG, Friston KJ. Distributional assumptions in voxel-based morphometry. Neuroimage. 2002;17:1027–1030. - PubMed
-
- Freedman D, Pisani R, Purves R. Statistics. New York: WW Norton; 2007.
Publication types
MeSH terms
Grants and funding
LinkOut - more resources
Full Text Sources
Other Literature Sources
Medical

