

Effect of high fat diet on paternal sperm histone distribution and male offspring liver gene expression
- PMID: 26252449
- PMCID: PMC4622005
- DOI: 10.1080/15592294.2015.1075691
Effect of high fat diet on paternal sperm histone distribution and male offspring liver gene expression
Abstract
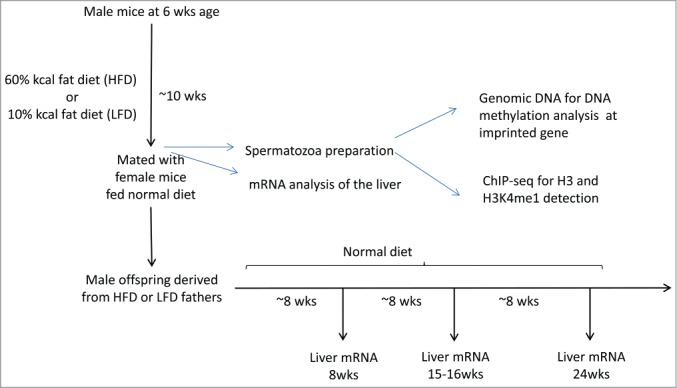
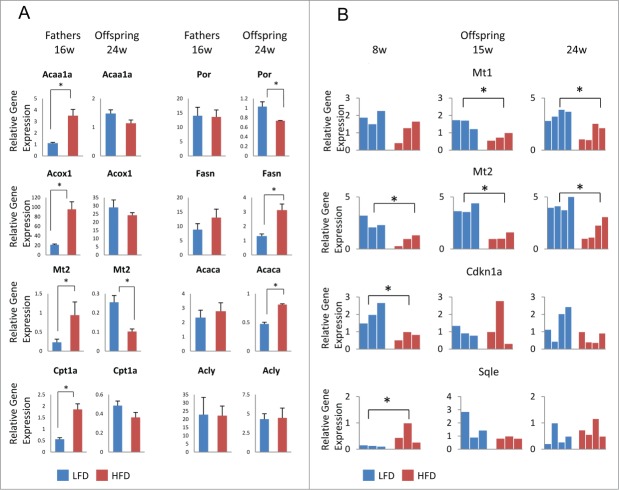
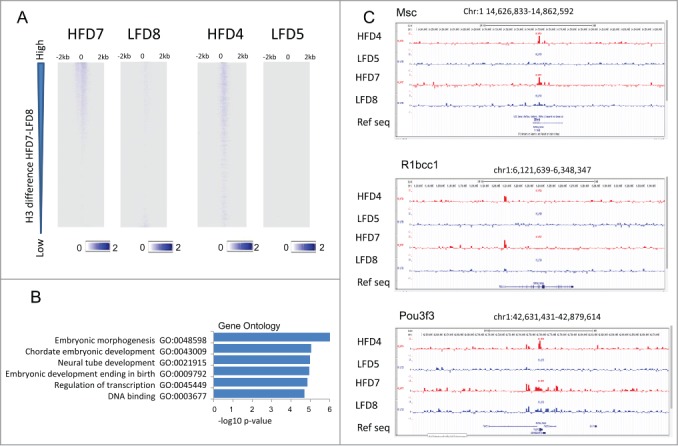
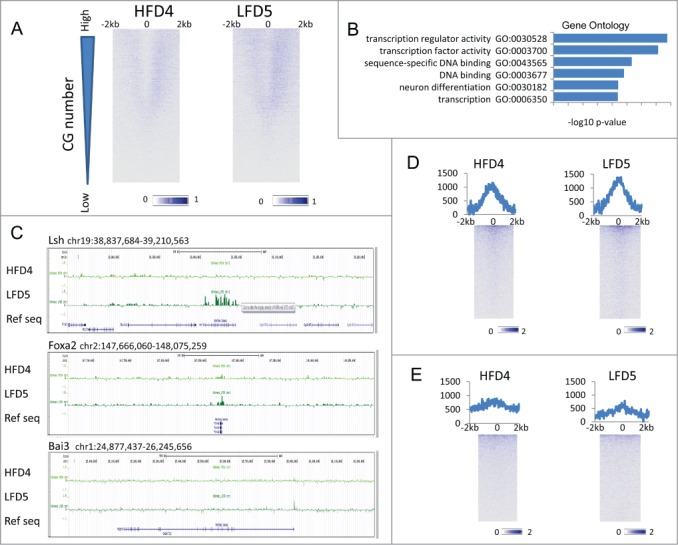
Several studies have described phenotypic changes in the offspring of mice exposed to a variety of environmental factors, including diet, toxins, and stress; however, the molecular pathways involved in these changes remain unclear. Using a high fat diet (HFD)-induced obesity mouse model, we examined liver gene expression in male offspring and analyzed chromatin of paternal spermatozoa. We found that the hepatic mRNA level of 7 genes (out of 20 evaluated) was significantly altered in HFD male offspring compared to control mice, suggesting that phenotypic changes in the offspring depend on parental diet. We examined 7 imprinted loci in spermatozoa DNA from HFD-treated and control fathers by bisulfite sequencing, but did not detect changes in DNA methylation associated with HFD. Using chromatin immunoprecipitation followed by high-throughput sequencing, we found differential histone H3-occupancy at genes involved in the regulation of embryogenesis and differential H3K4me1-enrichment at transcription regulatory genes in HFD fathers vs. control mice. These results suggest that dietary exposure can modulate histone composition at regulatory genes implicated in developmental processes.
Keywords: DNA methylation; epigenetic inheritance, high fat diet; epigenetics; histone H; obesity.
Figures

Similar articles
-
Sperm histone H3 lysine 4 tri-methylation serves as a metabolic sensor of paternal obesity and is associated with the inheritance of metabolic dysfunction.Mol Metab. 2022 May;59:101463. doi: 10.1016/j.molmet.2022.101463. Epub 2022 Feb 17. Mol Metab. 2022. PMID: 35183795 Free PMC article.
-
Chronic exposure to ethanol in male mice may be associated with hearing loss in offspring.Asian J Androl. 2015 Nov-Dec;17(6):985-90. doi: 10.4103/1008-682X.160267. Asian J Androl. 2015. PMID: 26262775 Free PMC article.
-
Paternal obesity impairs hepatic gluconeogenesis of offspring by altering Igf2/H19 DNA methylation.Mol Cell Endocrinol. 2021 Jun 1;529:111264. doi: 10.1016/j.mce.2021.111264. Epub 2021 Mar 31. Mol Cell Endocrinol. 2021. PMID: 33811969
-
Paternal obesity, interventions, and mechanistic pathways to impaired health in offspring.Ann Nutr Metab. 2014;64(3-4):231-8. doi: 10.1159/000365026. Epub 2014 Oct 2. Ann Nutr Metab. 2014. PMID: 25300265 Review.
-
Environmental epigenetic inheritance through gametes and implications for human reproduction.Hum Reprod Update. 2015 Mar-Apr;21(2):194-208. doi: 10.1093/humupd/dmu061. Epub 2014 Nov 21. Hum Reprod Update. 2015. PMID: 25416302 Review.
Cited by
-
Paternal multigenerational exposure to an obesogenic diet drives epigenetic predisposition to metabolic diseases in mice.Elife. 2021 Mar 30;10:e61736. doi: 10.7554/eLife.61736. Elife. 2021. PMID: 33783350 Free PMC article.
-
Paternal transgenerational epigenetic mechanisms mediating stress phenotypes of offspring.Eur J Neurosci. 2021 Jan;53(1):271-280. doi: 10.1111/ejn.14582. Epub 2019 Oct 17. Eur J Neurosci. 2021. PMID: 31549423 Free PMC article. Review.
-
Preconception paternal alcohol exposure exerts sex-specific effects on offspring growth and long-term metabolic programming.Epigenetics Chromatin. 2019 Jan 22;12(1):9. doi: 10.1186/s13072-019-0254-0. Epigenetics Chromatin. 2019. PMID: 30670059 Free PMC article.
-
Non-coding RNAs and chromatin: key epigenetic factors from spermatogenesis to transgenerational inheritance.Biol Res. 2021 Dec 20;54(1):41. doi: 10.1186/s40659-021-00364-0. Biol Res. 2021. PMID: 34930477 Free PMC article. Review.
-
Frequency, morbidity and equity - the case for increased research on male fertility.Nat Rev Urol. 2024 Feb;21(2):102-124. doi: 10.1038/s41585-023-00820-4. Epub 2023 Oct 12. Nat Rev Urol. 2024. PMID: 37828407 Review.
References
-
- Berger SL. The complex language of chromatin regulation during transcription. Nature 2007; 447:407-12; PMID:17522673; http://dx.doi.org/10.1038/nature05915 - DOI - PubMed
-
- Kouzarides T. Chromatin modifications and their function. Cell 2007; 128:693-705; PMID:17320507; http://dx.doi.org/10.1016/j.cell.2007.02.005 - DOI - PubMed
-
- Feng S, Jacobsen SE, Reik W. Epigenetic reprogramming in plant and animal development. Science 2010; 330:622-7; PMID:21030646; http://dx.doi.org/10.1126/science.1190614 - DOI - PMC - PubMed
-
- Hill PW, Amouroux R, Hajkova P. DNA demethylation, Tet proteins and 5-hydroxymethylcytosine in epigenetic reprogramming: an emerging complex story. Genomics 2014; 104:324-33; PMID:25173569; http://dx.doi.org/10.1016/j.ygeno.2014.08.012 - DOI - PubMed
Publication types
MeSH terms
Substances
Associated data
- Actions
Grants and funding
LinkOut - more resources
Full Text Sources
Other Literature Sources
Molecular Biology Databases