

Plasma Concentrations of Hepcidin in Anemic Zimbabwean Infants
- PMID: 26252205
- PMCID: PMC4529326
- DOI: 10.1371/journal.pone.0135227
Plasma Concentrations of Hepcidin in Anemic Zimbabwean Infants
Abstract
Objective: Anemia in infancy is a global public health problem. We evaluated the relative contributions of iron deficiency and inflammation to infant anemia.
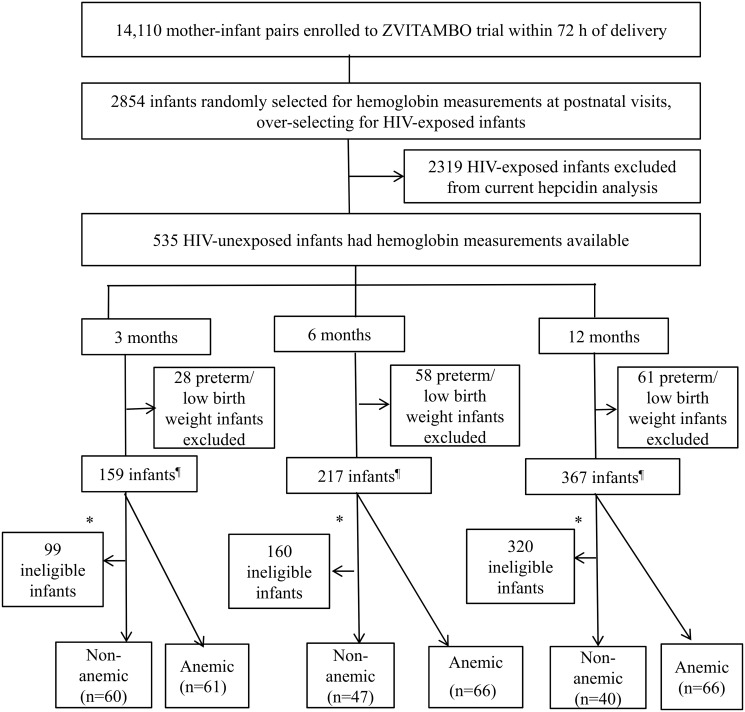
Methods: We measured plasma hepcidin, ferritin, soluble transferrin receptor (sTfR), alpha-1-acid glycoprotein and C-reactive protein (CRP) by ELISA on archived plasma from 289 HIV-unexposed anemic or non-anemic Zimbabwean infants at ages 3 mo, 6 mo and 12 mo. Among anemic infants, we determined the proportion with iron-deficiency anemia (IDA) and anemia of inflammation (AI). We undertook regression analyses of plasma hepcidin and anemia status, adjusting for sex, age and birthweight.
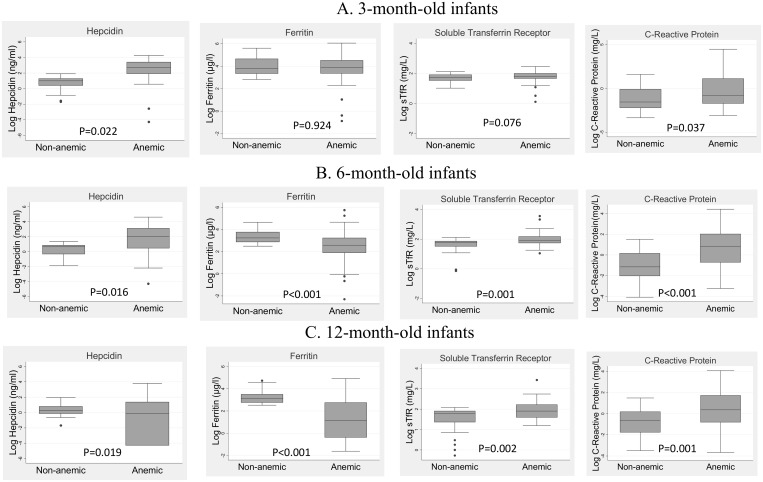
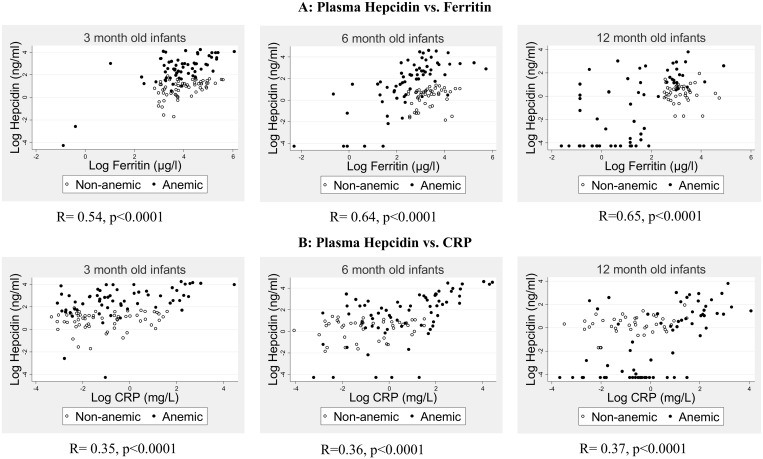
Results: Anemic infants at 3 mo were more stunted and had higher CRP (median 0.45 vs 0.21 mg/L; P = 0.037) and hepcidin (median 14.7 vs 9.7 ng/mL; P = 0.022) than non-anemic infants, but similar levels of ferritin and sTfR; 11% infants had IDA and 15% had AI. Anemic infants at 6 mo had higher hepcidin (median 7.9 vs 4.5 ng/mL; P = 0.016) and CRP (median 2.33 vs 0.32 mg/L; P<0.001), but lower ferritin (median 13.2 vs 25.1 μg/L; P<0.001) than non-anemic infants; 56% infants had IDA and 12% had AI. Anemic infants at 12 mo had lower ferritin (median 3.2 vs 22.2 μg/L; P<0.001) and hepcidin (median 0.9 vs 1.9 ng/mL; P = 0.019), but similar CRP levels; 48% infants had IDA and 8% had AI. Comparing anemic with non-anemic infants, plasma hepcidin was 568% higher, 405% higher and 64% lower at 3 mo, 6 mo and 12 mo, respectively, after adjusting for sex and birthweight (all p<0.01). Plasma hepcidin declined significantly with age among anemic but not non-anemic infants. Girls had 61% higher hepcidin than boys, after adjusting for age, anemia and birthweight (p<0.001).
Conclusion: Anemia is driven partly by inflammation early in infancy, and by iron deficiency later in infancy, with plasma hepcidin concentrations reflecting the relative contribution of each. However, there is need to better characterize the drivers of hepcidin during infancy in developing countries.
Conflict of interest statement
Figures
Similar articles
-
Hepcidin and other indicators of iron status, by alpha-1 acid glycoprotein levels, in a cohort of Mexican infants.Ann Hematol. 2021 Apr;100(4):879-890. doi: 10.1007/s00277-021-04402-5. Epub 2021 Jan 30. Ann Hematol. 2021. PMID: 33515046
-
Anemia of Inflammation during Human Pregnancy Does Not Affect Newborn Iron Endowment.J Nutr. 2018 Mar 1;148(3):427-436. doi: 10.1093/jn/nxx052. J Nutr. 2018. PMID: 29546300 Free PMC article. Clinical Trial.
-
Elevated Hepcidin Is Part of a Complex Relation That Links Mortality with Iron Homeostasis and Anemia in Men and Women with HIV Infection.J Nutr. 2015 Jun;145(6):1194-201. doi: 10.3945/jn.114.203158. Epub 2015 Apr 22. J Nutr. 2015. PMID: 25904736 Free PMC article.
-
Adjusting soluble transferrin receptor concentrations for inflammation: Biomarkers Reflecting Inflammation and Nutritional Determinants of Anemia (BRINDA) project.Am J Clin Nutr. 2017 Jul;106(Suppl 1):372S-382S. doi: 10.3945/ajcn.116.142232. Epub 2017 Jun 14. Am J Clin Nutr. 2017. PMID: 28615256 Free PMC article. Review.
-
Adjusting total body iron for inflammation: Biomarkers Reflecting Inflammation and Nutritional Determinants of Anemia (BRINDA) project.Am J Clin Nutr. 2017 Jul;106(Suppl 1):383S-389S. doi: 10.3945/ajcn.116.142307. Epub 2017 Jun 14. Am J Clin Nutr. 2017. PMID: 28615255 Free PMC article. Review.
Cited by
-
Iron Deficiency Anemia at Time of Vaccination Predicts Decreased Vaccine Response and Iron Supplementation at Time of Vaccination Increases Humoral Vaccine Response: A Birth Cohort Study and a Randomized Trial Follow-Up Study in Kenyan Infants.Front Immunol. 2020 Jul 13;11:1313. doi: 10.3389/fimmu.2020.01313. eCollection 2020. Front Immunol. 2020. PMID: 32754150 Free PMC article. Clinical Trial.
References
-
- WHO. (http://www.who.int/nutrition/topics/ida/en/ accessed15 May 2013)
-
- Walter T. Effect of iron-deficiency anaemia on cognitive skills in infancy and childhood. Baillieres Clin Haematol. 1994;7(4):815–27. Epub 1994/12/01. . - PubMed
-
- Walter T, De Andraca I, Chadud P, Perales CG. Iron deficiency anemia: adverse effects on infant psychomotor development. Pediatrics. 1989;84(1):7–17. Epub 1989/07/01. . - PubMed
Publication types
MeSH terms
Substances
Grants and funding
LinkOut - more resources
Full Text Sources
Other Literature Sources
Medical
Research Materials
Miscellaneous
