

Identifying children with excess malaria episodes after adjusting for variation in exposure: identification from a longitudinal study using statistical count models
- PMID: 26248615
- PMCID: PMC4527301
- DOI: 10.1186/s12916-015-0422-4
Identifying children with excess malaria episodes after adjusting for variation in exposure: identification from a longitudinal study using statistical count models
Abstract
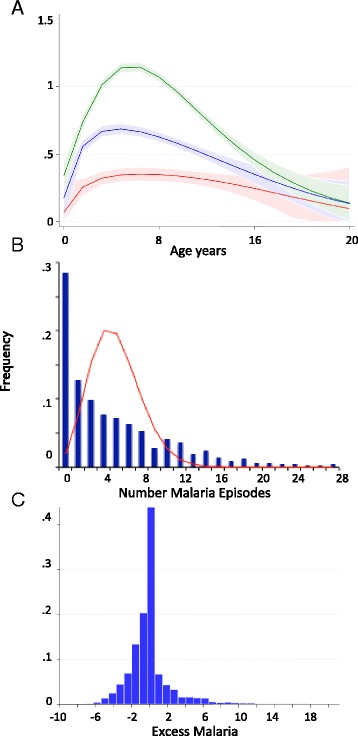
Background: The distribution of Plasmodium falciparum clinical malaria episodes is over-dispersed among children in endemic areas, with more children experiencing multiple clinical episodes than would be expected based on a Poisson distribution. There is consistent evidence for micro-epidemiological variation in exposure to P. falciparum. The aim of the current study was to identify children with excess malaria episodes after controlling for malaria exposure.
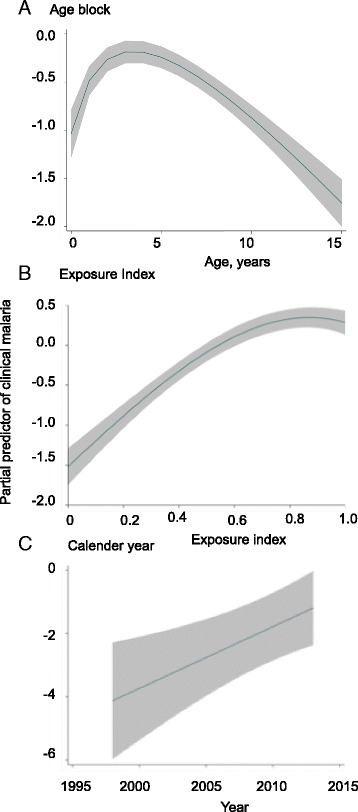
Methods: We selected the model that best fit the data out of the models examined and included the following covariates: age, a weighted local prevalence of infection as an index of exposure, and calendar time to predict episodes of malaria on active surveillance malaria data from 2,463 children of under 15 years of age followed for between 5 and 15 years each. Using parameters from the zero-inflated negative binomial model which best fitted our data, we ran 100 simulations of the model based on our population to determine the variation that might be seen due to chance.
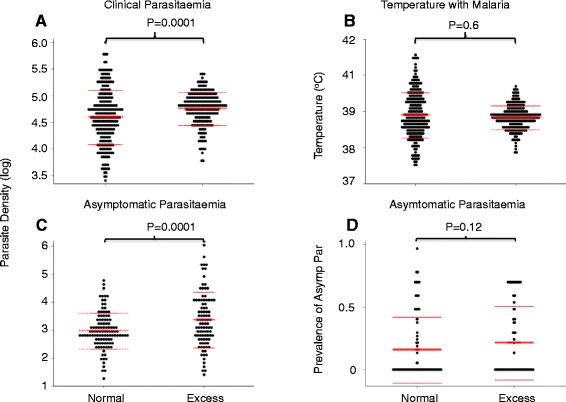
Results: We identified 212 out of 2,463 children who had a number of clinical episodes above the 95(th) percentile of the simulations run from the model, hereafter referred to as "excess malaria (EM)". We then identified exposure-matched controls with "average numbers of malaria" episodes, and found that the EM group had higher parasite densities when asymptomatically infected or during clinical malaria, and were less likely to be of haemoglobin AS genotype.
Conclusions: Of the models tested, the negative zero-inflated negative binomial distribution with exposure, calendar year, and age acting as independent predictors, fitted the distribution of clinical malaria the best. Despite accounting for these factors, a group of children suffer excess malaria episodes beyond those predicted by the model. An epidemiological framework for identifying these children will allow us to study factors that may explain excess malaria episodes.
Figures
Similar articles
-
Household level spatio-temporal analysis of Plasmodium falciparum and Plasmodium vivax malaria in Ethiopia.Parasit Vectors. 2017 Apr 20;10(1):196. doi: 10.1186/s13071-017-2124-6. Parasit Vectors. 2017. PMID: 28427451 Free PMC article.
-
A Cross-Sectional Population Study of Geographic, Age-Specific, and Household Risk Factors for Asymptomatic Plasmodium falciparum Malaria Infection in Western Kenya.Am J Trop Med Hyg. 2019 Jan;100(1):54-65. doi: 10.4269/ajtmh.18-0481. Am J Trop Med Hyg. 2019. PMID: 30457091 Free PMC article.
-
A country-wide malaria survey in Mozambique. II. Malaria attributable proportion of fever and establishment of malaria case definition in children across different epidemiological settings.Malar J. 2009 Apr 21;8:74. doi: 10.1186/1475-2875-8-74. Malar J. 2009. PMID: 19383126 Free PMC article.
-
Identification of different malaria patterns due to Plasmodium falciparum and Plasmodium vivax in Ethiopian children: a prospective cohort study.Malar J. 2016 Apr 14;15:208. doi: 10.1186/s12936-016-1253-2. Malar J. 2016. PMID: 27075667 Free PMC article.
-
The consequences of reducing transmission of Plasmodium falciparum in Africa.Adv Parasitol. 2002;52:235-64. doi: 10.1016/s0065-308x(02)52013-3. Adv Parasitol. 2002. PMID: 12521262 Review.
Cited by
-
Transmission and Age Impact the Risk of Developing Febrile Malaria in Children with Asymptomatic Plasmodium falciparum Parasitemia.J Infect Dis. 2019 Feb 23;219(6):936-944. doi: 10.1093/infdis/jiy591. J Infect Dis. 2019. PMID: 30307567 Free PMC article.
-
Factors influencing severity of recurrent malaria in a conflict-affected state of South Sudan: an unmatched case-control study.Confl Health. 2022 Jun 11;16(1):34. doi: 10.1186/s13031-022-00463-z. Confl Health. 2022. PMID: 35690836 Free PMC article.
-
Variation in natural exposure to anopheles mosquitoes and its effects on malaria transmission.Elife. 2018 Jan 23;7:e32625. doi: 10.7554/eLife.32625. Elife. 2018. PMID: 29357976 Free PMC article.
-
Parasitic Protozoa and Interactions with the Host Intestinal Microbiota.Infect Immun. 2017 Jul 19;85(8):e00101-17. doi: 10.1128/IAI.00101-17. Print 2017 Aug. Infect Immun. 2017. PMID: 28584161 Free PMC article. Review.
-
Endemic chikungunya fever in Kenyan children: a prospective cohort study.BMC Infect Dis. 2021 Feb 18;21(1):186. doi: 10.1186/s12879-021-05875-5. BMC Infect Dis. 2021. PMID: 33602147 Free PMC article.
References
Publication types
MeSH terms
Grants and funding
LinkOut - more resources
Full Text Sources
Other Literature Sources
Medical
Research Materials
Miscellaneous
