

MiR-26a functions oppositely in osteogenic differentiation of BMSCs and ADSCs depending on distinct activation and roles of Wnt and BMP signaling pathway
- PMID: 26247736
- PMCID: PMC4558512
- DOI: 10.1038/cddis.2015.221
MiR-26a functions oppositely in osteogenic differentiation of BMSCs and ADSCs depending on distinct activation and roles of Wnt and BMP signaling pathway
Abstract
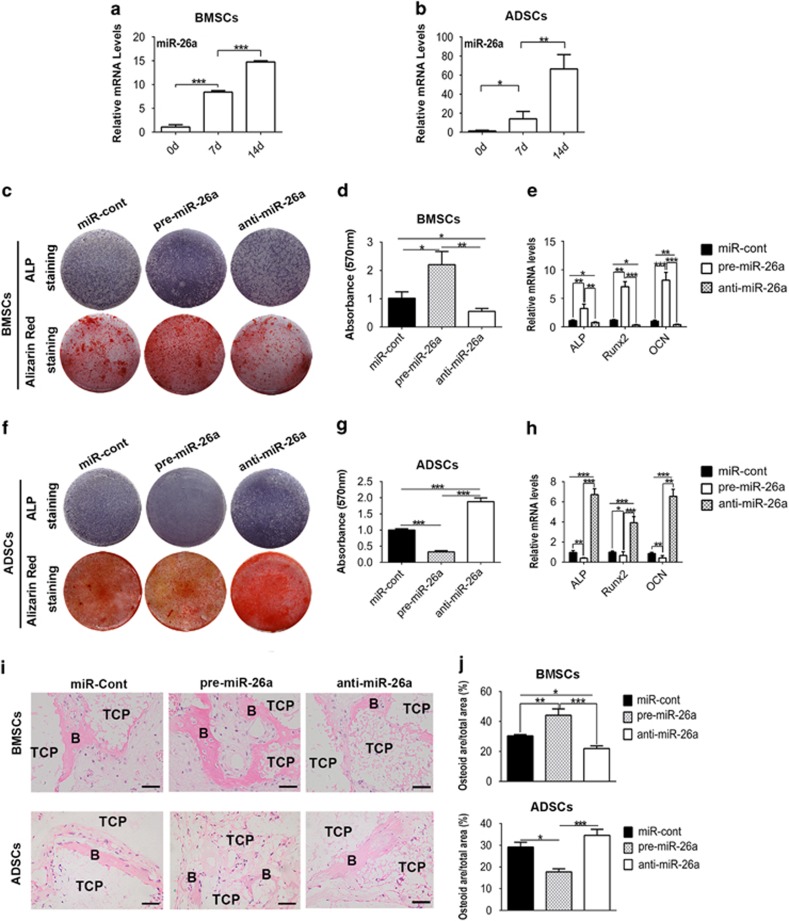
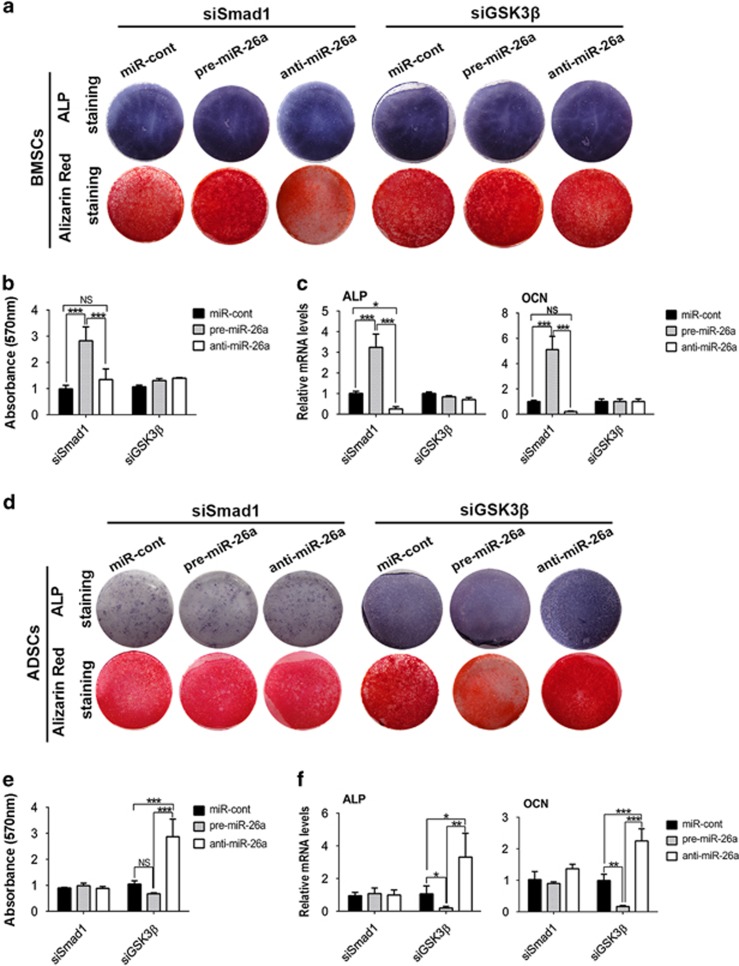
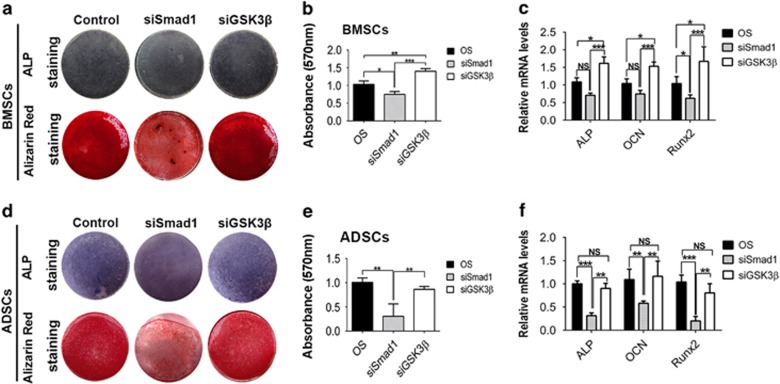
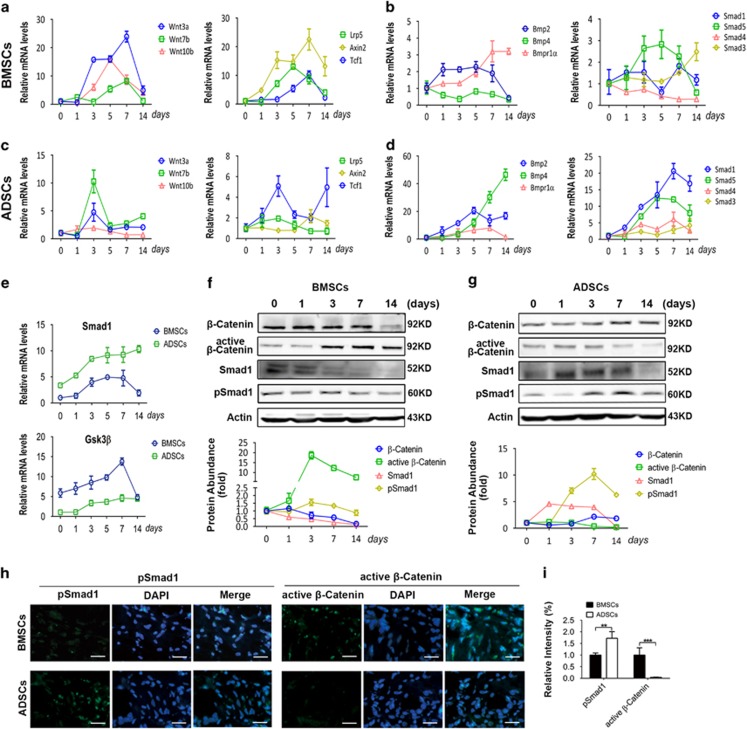
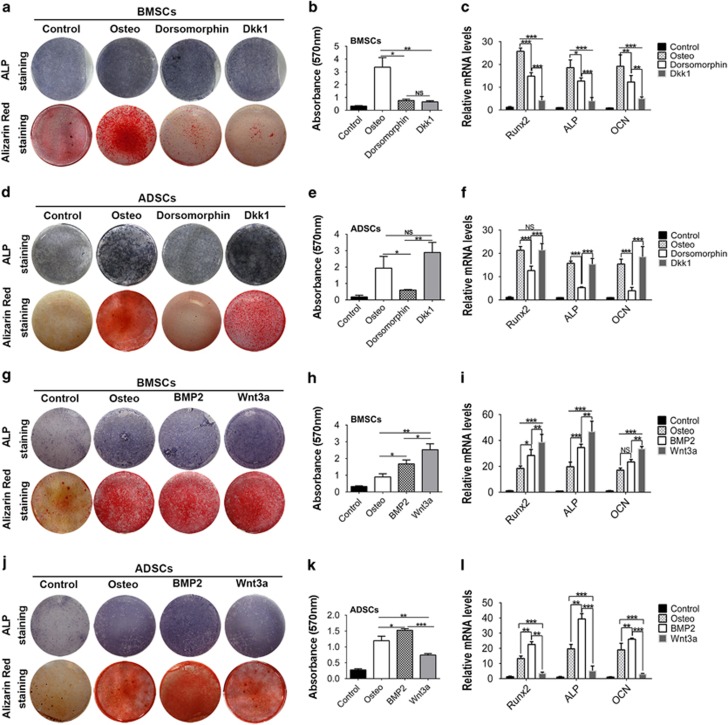
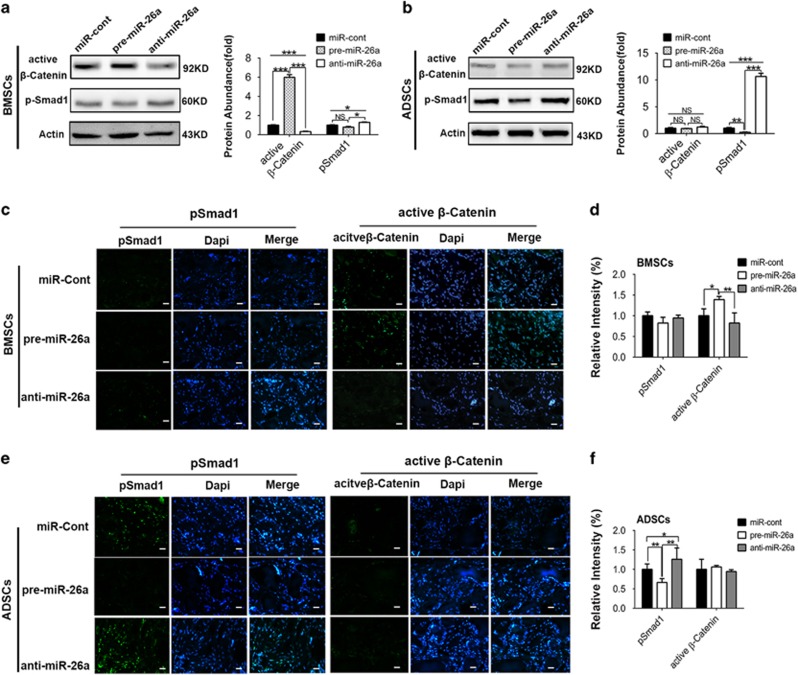
MicroRNAs (miRNAs) emerge as important regulators of stem cell lineage commitment and bone development. MiRNA-26a (miR-26a) is one of the important miRNAs regulating osteogenic differentiation of both bone marrow-derived mesenchymal stem cells (BMSCs) and adipose tissue-derived mesenchymal stem cells (ADSCs). However, miR-26a functions oppositely in osteogenic differentiation of BMSCs and ADSCs, suggesting distinct post-transcriptional regulation of tissue-specific MSC differentiation. However, the molecular basis is largely unknown. Here, we report that the function of miR-26a is largely depended on the intrinsic signaling regulation network of MSCs. Using bioinformatics and functional assay, we confirmed that miR-26a potentially targeted on GSK3β and Smad1 to regulate Wnt and BMP signaling pathway. Overall comparative analysis revealed that Wnt signaling was enhanced more potently and played a more important role than BMP signaling in osteogenic differentiation of BMSCs, whereas BMP pathway was more essential for promoting osteogenic differentiation of ADSCs. The distinct activation pattern and role of signaling pathways determined that miR-26a majorly targeted on GSK3β to activate Wnt signaling for promoting osteogenic differentiation of BMSCs, whereas it inhibited Smad1 to suppress BMP signaling for interfering with the osteogenic differentiation of ADSCs. Taken together, our study demonstrated that BMSCs and ADSCs applied different signaling pathway to facilitate their osteogenic differentiation, which determined the inverse function of miR-26a. The distinct transcriptional regulation and post-transcriptional regulation network suggested the intrinsic molecular differences between tissue-specific MSCs and the complexity in MSC research and MSC-based cell therapy.
Figures

Similar articles
-
Effect of miR-26a-5p on the Wnt/Ca(2+) Pathway and Osteogenic Differentiation of Mouse Adipose-Derived Mesenchymal Stem Cells.Calcif Tissue Int. 2016 Aug;99(2):174-86. doi: 10.1007/s00223-016-0137-3. Epub 2016 Apr 4. Calcif Tissue Int. 2016. PMID: 27040676
-
A signal-amplification circuit between miR-218 and Wnt/β-catenin signal promotes human adipose tissue-derived stem cells osteogenic differentiation.Bone. 2014 Jan;58:59-66. doi: 10.1016/j.bone.2013.09.015. Epub 2013 Sep 30. Bone. 2014. PMID: 24091133
-
MiR-154-5p regulates osteogenic differentiation of adipose-derived mesenchymal stem cells under tensile stress through the Wnt/PCP pathway by targeting Wnt11.Bone. 2015 Sep;78:130-41. doi: 10.1016/j.bone.2015.05.003. Epub 2015 May 7. Bone. 2015. PMID: 25959411
-
PPARγ and Wnt Signaling in Adipogenic and Osteogenic Differentiation of Mesenchymal Stem Cells.Curr Stem Cell Res Ther. 2016;11(3):216-25. doi: 10.2174/1574888x10666150519093429. Curr Stem Cell Res Ther. 2016. PMID: 25986621 Review.
-
MicroRNA Regulation in Osteogenic and Adipogenic Differentiation of Bone Mesenchymal Stem Cells and its Application in Bone Regeneration.Curr Stem Cell Res Ther. 2018;13(1):26-30. doi: 10.2174/1574888X12666170605112727. Curr Stem Cell Res Ther. 2018. PMID: 28578644 Review.
Cited by
-
Long Noncoding RNA H19 Participates in the Regulation of Adipose-Derived Stem Cells Cartilage Differentiation.Stem Cells Int. 2019 May 5;2019:2139814. doi: 10.1155/2019/2139814. eCollection 2019. Stem Cells Int. 2019. PMID: 31191668 Free PMC article.
-
Effects of WNT3A and WNT16 on the Osteogenic and Adipogenic Differentiation of Perivascular Stem/Stromal Cells.Tissue Eng Part A. 2018 Jan;24(1-2):68-80. doi: 10.1089/ten.TEA.2016.0387. Epub 2017 May 22. Tissue Eng Part A. 2018. PMID: 28463594 Free PMC article.
-
Exosomes derived from miR-26a-modified MSCs promote axonal regeneration via the PTEN/AKT/mTOR pathway following spinal cord injury.Stem Cell Res Ther. 2021 Apr 5;12(1):224. doi: 10.1186/s13287-021-02282-0. Stem Cell Res Ther. 2021. PMID: 33820561 Free PMC article.
-
MiR-26a promotes fracture healing of nonunion rats possibly by targeting SOSTDC1 and further activating Wnt/β-catenin signaling pathway.Mol Cell Biochem. 2019 Oct;460(1-2):165-173. doi: 10.1007/s11010-019-03578-9. Epub 2019 Jul 16. Mol Cell Biochem. 2019. PMID: 31313025
-
Adipose mesenchymal stem cells from osteoporotic donors preserve functionality and modulate systemic inflammatory microenvironment in osteoporotic cytotherapy.Sci Rep. 2018 Mar 26;8(1):5215. doi: 10.1038/s41598-018-23098-8. Sci Rep. 2018. PMID: 29581449 Free PMC article.
References
-
- Karsenty G, Kronenberg HM, Settembre C. Genetic control of bone formation. Annu Rev Cell Dev Biol. 2009;25:629–648. - PubMed
-
- Karsenty G. Transcriptional control of skeletogenesis. Annu Rev Genomics Hum Genet. 2008;9:183–196. - PubMed
-
- Long F. Building strong bones: molecular regulation of the osteoblast lineage. Nat Rev Mol Cell Biol. 2012;13:27–38. - PubMed
-
- Dirks PB. MicroRNAs and parallel stem cell lives. Cell. 2009;138:423–424. - PubMed
Publication types
MeSH terms
Substances
LinkOut - more resources
Full Text Sources
Other Literature Sources
