

Inhibition of miR-29 has a significant lipid-lowering benefit through suppression of lipogenic programs in liver
- PMID: 26246194
- PMCID: PMC4526858
- DOI: 10.1038/srep12911
Inhibition of miR-29 has a significant lipid-lowering benefit through suppression of lipogenic programs in liver
Abstract
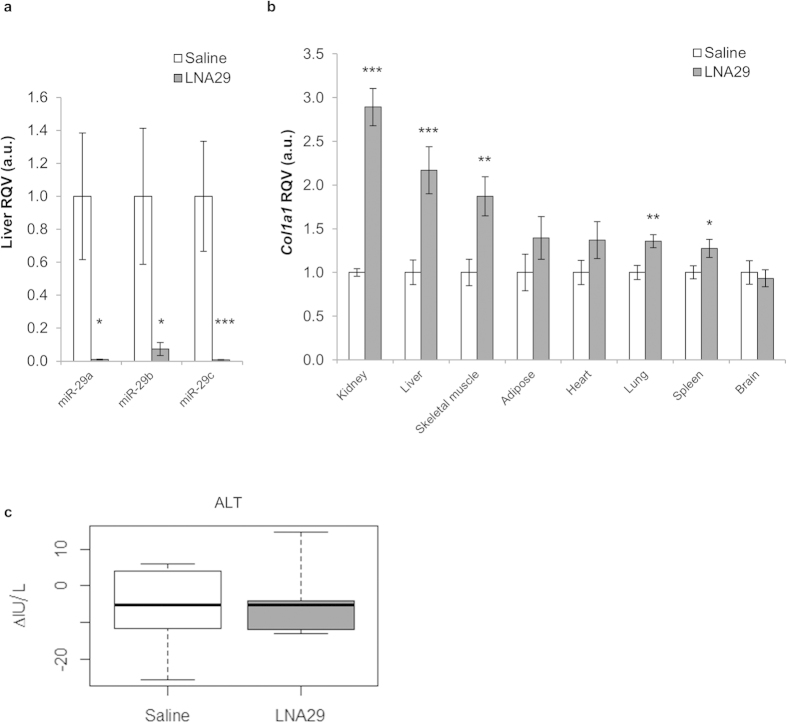
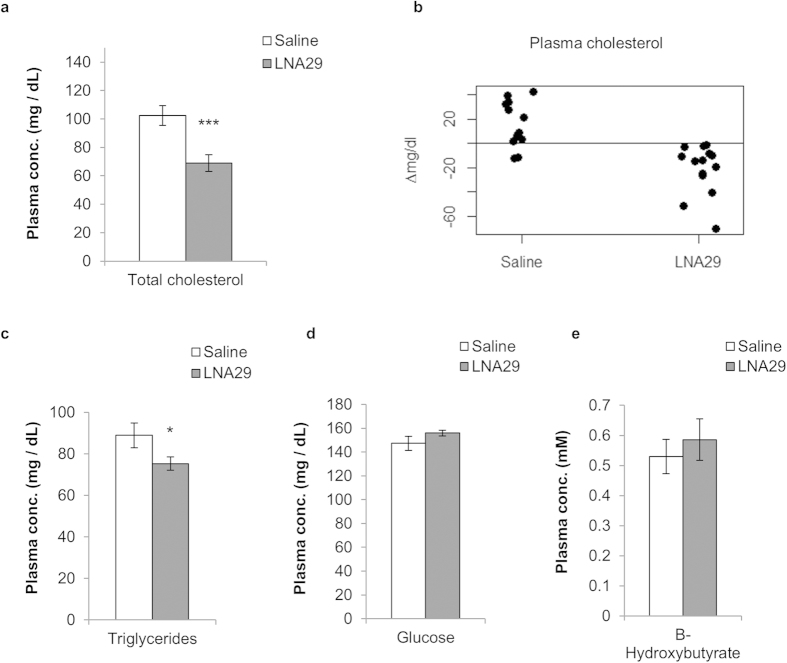
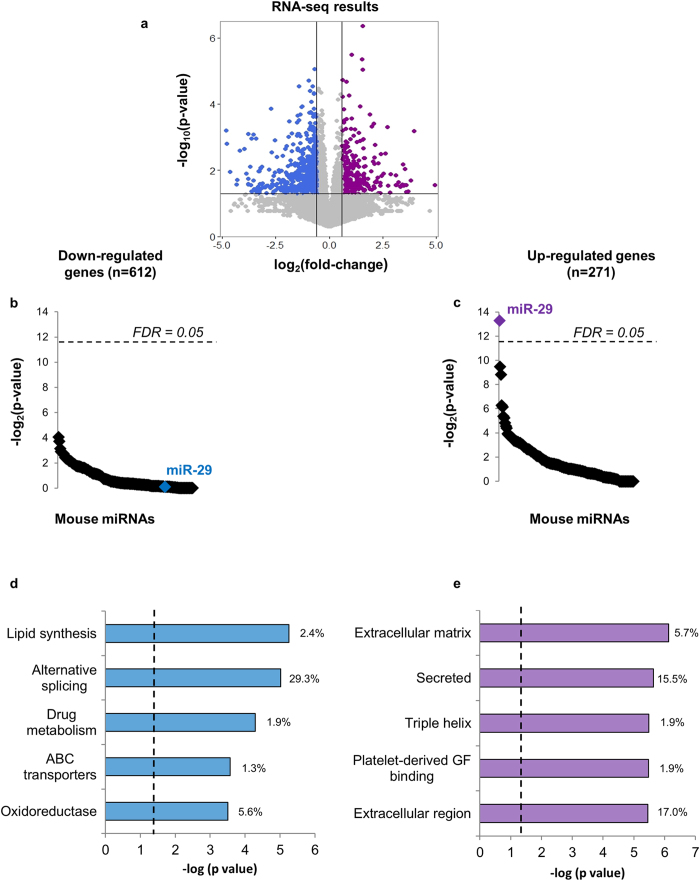
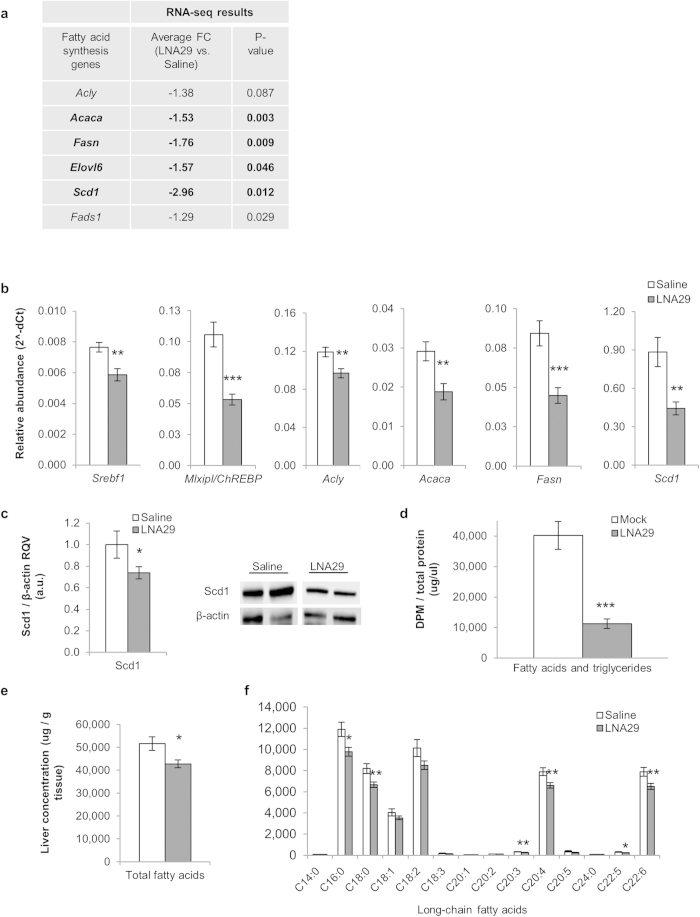
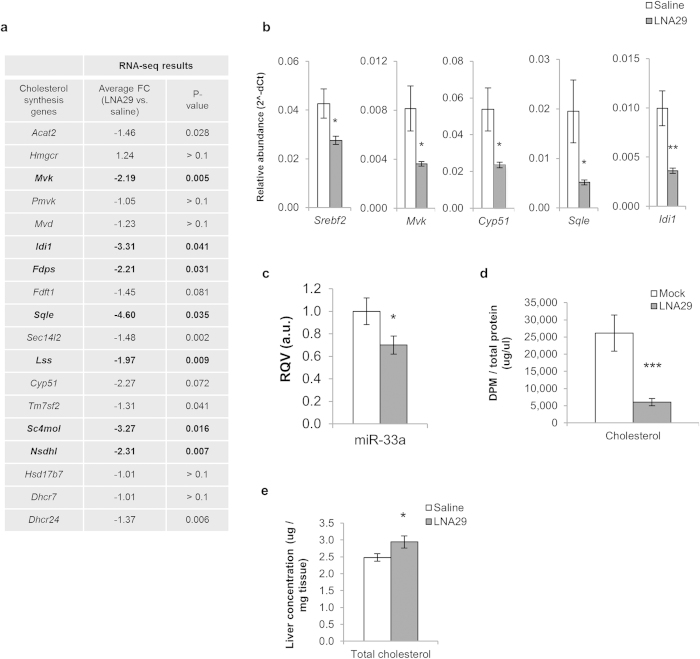
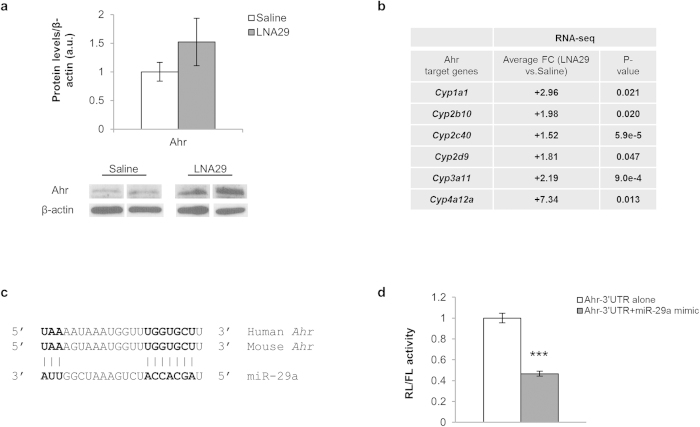
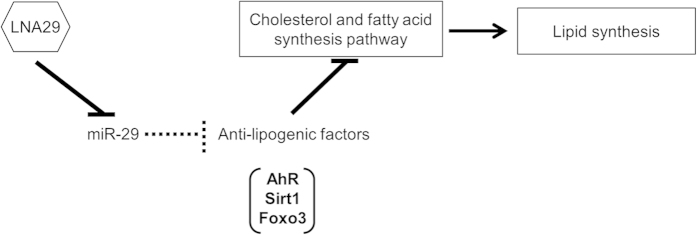
MicroRNAs (miRNAs) are important regulators and potential therapeutic targets of metabolic disease. In this study we show by in vivo administration of locked nucleic acid (LNA) inhibitors that suppression of endogenous miR-29 lowers plasma cholesterol levels by ~40%, commensurate with the effect of statins, and reduces fatty acid content in the liver by ~20%. Whole transcriptome sequencing of the liver reveals 883 genes dysregulated (612 down, 271 up) by inhibition of miR-29. The set of 612 down-regulated genes are most significantly over-represented in lipid synthesis pathways. Among the up-regulated genes are the anti-lipogenic deacetylase sirtuin 1 (Sirt1) and the anti-lipogenic transcription factor aryl hydrocarbon receptor (Ahr), the latter of which we demonstrate is a direct target of miR-29. In vitro radiolabeled acetate incorporation assays confirm that pharmacologic inhibition of miR-29 significantly reduces de novo cholesterol and fatty acid synthesis. Our findings indicate that miR-29 controls hepatic lipogenic programs, likely in part through regulation of Ahr and Sirt1, and therefore may represent a candidate therapeutic target for metabolic disorders such as dyslipidemia.
Figures
Similar articles
-
MiR-29 Regulates de novo Lipogenesis in the Liver and Circulating Triglyceride Levels in a Sirt1-Dependent Manner.Front Physiol. 2019 Oct 29;10:1367. doi: 10.3389/fphys.2019.01367. eCollection 2019. Front Physiol. 2019. PMID: 31736786 Free PMC article.
-
Increased expression of miR-34a and miR-93 in rat liver during aging, and their impact on the expression of Mgst1 and Sirt1.Mech Ageing Dev. 2011 Mar;132(3):75-85. doi: 10.1016/j.mad.2010.12.004. Epub 2011 Jan 7. Mech Ageing Dev. 2011. PMID: 21216258
-
miR-122 regulation of lipid metabolism revealed by in vivo antisense targeting.Cell Metab. 2006 Feb;3(2):87-98. doi: 10.1016/j.cmet.2006.01.005. Cell Metab. 2006. PMID: 16459310
-
Antagonism of microRNA-122 in mice by systemically administered LNA-antimiR leads to up-regulation of a large set of predicted target mRNAs in the liver.Nucleic Acids Res. 2008 Mar;36(4):1153-62. doi: 10.1093/nar/gkm1113. Epub 2007 Dec 23. Nucleic Acids Res. 2008. PMID: 18158304 Free PMC article.
-
Integrative roles of microRNAs in lipid metabolism and dyslipidemia.Curr Opin Lipidol. 2019 Jun;30(3):165-171. doi: 10.1097/MOL.0000000000000603. Curr Opin Lipidol. 2019. PMID: 30985366 Free PMC article. Review.
Cited by
-
The Crosstalk of miRNA and Oxidative Stress in the Liver: From Physiology to Pathology and Clinical Implications.Int J Mol Sci. 2019 Oct 23;20(21):5266. doi: 10.3390/ijms20215266. Int J Mol Sci. 2019. PMID: 31652839 Free PMC article. Review.
-
MicroRNA-29a Attenuates Diabetic Glomerular Injury through Modulating Cannabinoid Receptor 1 Signaling.Molecules. 2019 Jan 11;24(2):264. doi: 10.3390/molecules24020264. Molecules. 2019. PMID: 30642005 Free PMC article.
-
Role of miR-653 and miR-29c in downregulation of CYP1A2 expression in hepatocellular carcinoma.Pharmacol Rep. 2022 Feb;74(1):148-158. doi: 10.1007/s43440-021-00338-9. Epub 2021 Nov 15. Pharmacol Rep. 2022. PMID: 34780054
-
Integrating experimental model, LC-MS/MS chemical analysis, and systems biology approach to investigate the possible antidiabetic effect and mechanisms of Matricaria aurea (Golden Chamomile) in type 2 diabetes mellitus.Front Pharmacol. 2022 Sep 7;13:924478. doi: 10.3389/fphar.2022.924478. eCollection 2022. Front Pharmacol. 2022. PMID: 36160451 Free PMC article.
-
Crosstalk between microRNAs, the putative target genes and the lncRNA network in metabolic diseases.Mol Med Rep. 2019 Oct;20(4):3543-3554. doi: 10.3892/mmr.2019.10595. Epub 2019 Aug 21. Mol Med Rep. 2019. PMID: 31485667 Free PMC article.
References
-
- Ling J., Lewis J., Douglas D., Kneteman N. M. & Vance D. E. Characterization of lipid and lipoprotein metabolism in primary human hepatocytes. Biochim. Biophys. Acta. 1831, 387–397 (2013). - PubMed
-
- Sacco J. & Adeli K. MicroRNAs: emerging roles in lipid and lipoprotein metabolism. Curr. Opin. Lipidol. 23, 220–225 (2012). - PubMed
Publication types
MeSH terms
Substances
Grants and funding
LinkOut - more resources
Full Text Sources
Other Literature Sources
Molecular Biology Databases
