. 2015 Nov;25(11):1680-91.
doi: 10.1101/gr.183160.114. Epub 2015 Jul 31.

Cooperative target mRNA destabilization and translation inhibition by miR-58 microRNA family in C. elegans

Affiliations

Cooperative target mRNA destabilization and translation inhibition by miR-58 microRNA family in C. elegans

Deni Subasic et al. Genome Res. 2015 Nov.

Abstract

In animals, microRNAs frequently form families with related sequences. The functional relevance of miRNA families and the relative contribution of family members to target repression have remained, however, largely unexplored. Here, we used the Caenorhabditis elegans miR-58 miRNA family, composed primarily of the four highly abundant members miR-58.1, miR-80, miR-81, and miR-82, as a model to investigate the redundancy of miRNA family members and their impact on target expression in an in vivo setting. We found that miR-58 family members repress largely overlapping sets of targets in a predominantly additive fashion. Progressive deletions of miR-58 family members lead to cumulative up-regulation of target protein and RNA levels. Phenotypic defects could only be observed in the family quadruple mutant, which also showed the strongest change in target protein levels. Interestingly, although the seed sequences of miR-80 and miR-58.1 differ in a single nucleotide, predicted canonical miR-80 targets were efficiently up-regulated in the mir-58.1 single mutant, indicating functional redundancy of distinct members of this miRNA family. At the aggregate level, target binding leads mainly to mRNA degradation, although we also observed some degree of translational inhibition, particularly in the single miR-58 family mutants. These results provide a framework for understanding how miRNA family members interact to regulate target mRNAs.


Figures

Figure 1.
Figure 1.
A combined selected reaction monitoring (SRM) and SILAC approach reveals additive target protein regulation of miR-58 family members. (A) Cumulative distributions of log2 fold expression changes of the 63 TargetScan-predicted miR-58 targets in the mir-58.1, mir-80; mir-58.1, and mir-80; mir-58.1; mir-81-82 mutants relative to the wild type (WT) indicate increased protein abundance with each miR-58 family mutation introduced. Quantified TargetScan-predicted targets identified in SRM, fractionated SILAC, and unfractionated SILAC were compared to a group of 518 nontargets identified in unfractionated SILAC measurements for which we also had transcript abundance data. P-values were calculated using Kolmogorov–Smirnov (KS) test comparing the fold change distributions (log2) of targets and nontargets. (B) Mean log2 fold changes of protein abundances of miRNA targets and nontargets in the different miR-58 family mutants relative to the WT indicate a cumulative effect of miRNA mutations. (C) Differential expression of 55 TargetScan-predicted miR-58 family targets quantified by SRM and unfractionated and fractionated SILAC in mir-58.1, mir-80; mir-58.1, and mir-80; mir-58.1; mir-81-82 relative to the WT. The protein ID indicates the specific protein quantified in different mutants relative to the WT. Proteins are sorted according to increasing up-regulation in the mir-80; mir-58.1; mir-81-82 quadruple mutant. It is apparent that each additional miRNA mutations further increases the expression of TargetScan-predicted targets compared with random controls. (D) Cumulative distributions of log2 protein-level fold changes of 58 noncanonical targets identified by MIRZA (score cutoff > 10) quantified by unfractionated and fractionated SILAC and of 518 nontargets described above in different miR-58 family mutant backgrounds. P-values were calculated using KS test comparing the fold change distributions (log2) of targets and nontargets. (E) Cumulative distributions of log2 protein-level fold changes of ALG-1–bound miR-58 family targets and of 518 nontargets described above in different miR-58 family mutant backgrounds compared with the WT. Requiring that a target reported by Grosswendt et al. (2014) is supported by at least five reads yielded 43 miR-58 family targets; of these, we obtained SILAC data for 16 targets. P-values were calculated using KS test comparing the fold change distributions (log2) of targets and nontargets.
Figure 2.
Figure 2.
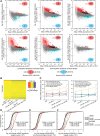
Mutations in individual miR-58 family members additively increase target RNA levels. (A) Plots of the log2 fold change in mRNA abundance between the conditions indicated on the y-axes against the expression level in the condition indicated on the x-axes. Transcripts deemed by DESeq (Anders and Huber 2010) significantly up-regulated or down-regulated transcripts with P(adjusted) < 0.01 are shown as red and blue dots, respectively, and their number is indicated in the upper right or lower right part of the plot. Significantly up-regulated (red) and down-regulated (blue) TargetScan-predicted miR-58.1, miR-80/81/82, and shared miR-58.1/80/81/82 targets are marked with bold dots, and their numbers are indicated in the Venn diagrams. (B) Heatmap indicating differential mRNA expression levels (log2 fold change [FC]) of 16,309 transcripts across different miR-58 family mutants. (C) Average mRNA abundances (in reads per million [rpm]) of groups of transcripts identified in all four conditions containing different seed matches—8mer, 7mer-m8, 7mer-A1, 6mer—and without seed match (in wild type, mir-58.1, mir-80; mir-58.1, and mir-80; mir-58.1; mir-81-82) indicate average contributions of miR-58 family members in their target up-regulation. TargetScan-predicted miR-58.1– and miR-80/81/82–specific and overlapping targets show similar additive trends. Error bars, SD. (DF) Cumulative distributions of log2 fold changes of the following and 518 nontargets in different miR-58 family mutants compared with WT: (D) 63 TargetScan-predicted targets, (E) 58 noncanonical targets identified by MIRZA (score cutoff > 10), and (F) 39 ALG-1–bound miR-58 family targets (Grosswendt et al. 2014). P-values were calculated using a KS test comparing the fold change distributions (log2) of targets and nontargets.
Figure 3.
Figure 3.
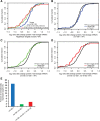
Reduced relative translation efficiency of miR-58 targets in multiple, but not single, miR-58 family mutants. (AD) Translational efficiency calculated as log2 (fold change protein abundance/fold change mRNA abundance) for targets and 518 nontargets. P-values were calculated using a KS test comparing the fold change distributions (log2) of targets in mir-80; mir-58.1 double and mir-80; mir-58.1; mir-81-82 quadruple mutants to the mir-58.1 single mutant (A) and of targets to nontargets (BD). (E) Release of translational inhibition is particularly prominent in the single mir-58 mutant. Fraction of translationally repressed [log2 fold change protein abundance (mutant/WT) > 0.05, log2 mRNA abundance (mutant/WT) < 0.05] TargetScan-predicted targets in mir-58.1 single, mir-80; mir-58.1 double, and mir-80; mir-58.1; mir-81-82 quadruple mutants.
Figure 4.
Figure 4.
Loss of miR-58 family members does not lead to any compensation effects among other family members. (A) Small RNA sequencing comparing miRNA abundance in reads per million between different miR-58 family mutant samples and the WT. The reads are normalized to the four calibration sequences that were added in the sample in equal amounts during miRNA library preparation (marked as green stars on the plot). (B) miRNA-qRT-PCR assaying relative fold change of miR-58.1, miR-80, miR-81, and miR-82 in different miR-58 family mutant backgrounds identified no significant changes. The levels were normalized to the miRNAs stably expressed throughout the development, miR-250 and miR-52 (Kato et al. 2009), and are relative to WT. Standard deviations between three biological replicates are indicated.
Figure 5.
Figure 5.
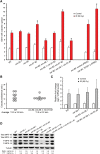
miR-58 family mutants show defective apoptotic response following irradiation. (A) mir-80; mir-58.1 and mir-80; mir-58.1; mir-81-82 mutants show decreased germline apoptosis following IR, while mir-81-82 double and mir-80; mir-81-82 triple mutant show an increase in IR-induced apoptosis levels. RNAi of T07D1.2, a gene largely deleted in nDf54 deficiency that covers miR-81 and miR-82 locus, induces germline apoptosis following IR. Empty vector was used as control RNAi. Synchronized animals in L4 larval stage were irradiated, and DNA damage–induced germline apoptosis was quantified 24 h after irradiation. Error bars, SEM from three biological replicates (20 worms were scored per experiment); asterisk, P-value for a paired t-test comparing the mutants/T07D1.2 RNAi to the WT/empty vector control (*P < 0.001 IR samples). (B) Apoptotic clearance is not impaired in the mir-80; mir-58.1; mir-81-82 quadruple mutant. Time of corpse persistence was assayed by measuring the time from the corpse's first appearance until it was no longer visible. Average persistence and SD are denoted below the chart. (C) Transcriptional up-regulation of egl-1 following IR is normal in the various miR-58 family mutants. mRNA was extracted 12 h after irradiation of L4 larvae, and egl-1 levels were assayed by quantitative real-time PCR. mRNA levels for each sample were normalized to three housekeeping genes—pgk-1, cdc-42, and Y45F10—and the fold induction was calculated relative to wild-type untreated worms. Error bars, SEM (n = 2). (D) Levels of MPK-1 activation (phosphorylation) differ between various miR-58 family mutants. Protein was extracted from irradiated and nonirradiated young adult worms, and equal amounts were loaded onto SDS-PAGE gels. Total MPK-1 was detected with an anti-ERK-antibody, activated MPK-1 was detected with an anti-P-ERK antibody, and a-tubulin was used as a loading control. The ratio of activated MPK-1 (P) to total MPK-1 (T) normalized against wild-type nonirradiated worms is shown for the MPK-1A and MPK-1B isoforms.

Similar articles

Cited by

References

    1. Alvarez-Saavedra E, Horvitz HR. 2010. Many families of C. elegans microRNAs are not essential for development or viability. Curr Biol 20: 367–373. - PMC - PubMed
    1. Anders S, Huber W. 2010. Differential expression analysis for sequence count data. Genome Biol 11: R106. - PMC - PubMed
    1. Baek D, Villén J, Shin C, Camargo FD, Gygi SP, Bartel DP. 2008. The impact of microRNAs on protein output. Nature 455: 64–71. - PMC - PubMed
    1. Bartel DP. 2009. MicroRNAs: target recognition and regulatory functions. Cell 136: 215–233. - PMC - PubMed
    1. Bazzini AA, Lee MT, Giraldez AJ. 2012. Ribosome profiling shows that miR-430 reduces translation before causing mRNA decay in zebrafish. Science 336: 233–237. - PMC - PubMed

Publication types

Associated data