

Mitophagy defects arising from BNip3 loss promote mammary tumor progression to metastasis
- PMID: 26232272
- PMCID: PMC4576983
- DOI: 10.15252/embr.201540759
Mitophagy defects arising from BNip3 loss promote mammary tumor progression to metastasis
Abstract
BNip3 is a hypoxia-inducible protein that targets mitochondria for autophagosomal degradation. We report a novel tumor suppressor role for BNip3 in a clinically relevant mouse model of mammary tumorigenesis. BNip3 delays primary mammary tumor growth and progression by preventing the accumulation of dysfunctional mitochondria and resultant excess ROS production. In the absence of BNip3, mammary tumor cells are unable to reduce mitochondrial mass effectively and elevated mitochondrial ROS increases the expression of Hif-1α and Hif target genes, including those involved in glycolysis and angiogenesis—two processes that are also markedly increased in BNip3-null tumors. Glycolysis inhibition attenuates the growth of BNip3-null tumor cells, revealing an increased dependence on autophagy for survival. We also demonstrate that BNIP3 deletion can be used as a prognostic marker of tumor progression to metastasis in human triple-negative breast cancer (TNBC). These studies show that mitochondrial dysfunction—caused by defects in mitophagy—can promote the Warburg effect and tumor progression, and suggest better approaches to stratifying TNBC for treatment.
Keywords: BNip3; HIF‐1α; ROS; breast cancer; glycolysis; invasive carcinoma; mitophagy.
© 2015 The Authors.
Figures

A, B BNip3 protein expression during mammary tumorigenesis in MMTV-PyMT mice detected at the adenoma/MIN stage of progression (50–65 days of age, n = 4), early carcinoma stage of tumorigenesis (65–80 days of age), late carcinoma stage (80–95 days of age, n = 4), metastatic carcinoma (95–105 days of age, n = 4) and in lung metastases (95–105 days of age, n = 4). Scale bar is 100 μm.
C Kaplan–Meier survival curve of MMTV-PyMT mice with either a wild-type (blue, n = 11) or BNip3 null (red, n = 11) background. Median survival of wild-type mice was 104 days and 80 days for BNip3 null mice. Significance P < 0.0001.
D Primary mammary tumor weights at d80 in wild-type (n = 24) and BNip3 null mice (n = 21).
E Gradient echo MRI images of mammary tumors (red arrows indicate the presence of tumor) at imaging resolution of approximately 117 mm, and slice thickness 0.5 mm.
F, G Immunohistochemical staining for Ki67 in wild-type (n = 20) and BNip3 null (n = 20) tumor sections at d65. Scale bar is 50 μm. Red arrows indicate regions of ectopic proliferation.
H Growth rate of primary wild-type (blue) and BNip3 null (red) MECs in vitro at 20% or 1% oxygen, measured in triplicate experiments.
I Growth rate of parental BNip3 null MECs, untreated or expressing either control empty vector (+ Empty vector) or BNip3-expressing vector (+ BNip3-WT), measured in triplicate experiments.

A, B BNip3 protein expression determined by immunohistochemistry at early carcinoma stage of tumorigenesis (65–80 days of age) in wild-type (A) and BNip3 null (B). Scale bar is 200 μm.
C Western blot analysis for expression of BNip3 in extracts from wild-type and BNip3 null MECs grown at 20% and 1% oxygen.
D Cell cycle phase distribution of wild-type and BNip3 null MECs measured in triplicate experiments by BrdU labeling over 5 h in culture followed by labeling of fixed cells with α-BrdU and PI. Results are expressed as the mean ± SEM. ****P < 0.0001.
E Western blot analysis for expression of exogenous BNip3 in extracts from parental BNip3 null MECs (Par), BNip3 null MECs expressing empty control vector (+ Empty vector) or BNip3 null MECs expressing exogenous BNip3 (+ BNip3-WT) grown at 20% and 1% oxygen.

A–D TUNEL staining on wild-type and BNip3 null tumors at d65 and d80.
E Quantification of TUNEL staining from (A–D). Results are expressed as the mean ± SEM.
F Flow cytometric analysis of PI exclusion as a measure of cell death on wild-type and BNip3 null MECs grown at 20% or 1% oxygen. Results are expressed as the mean ± SEM.
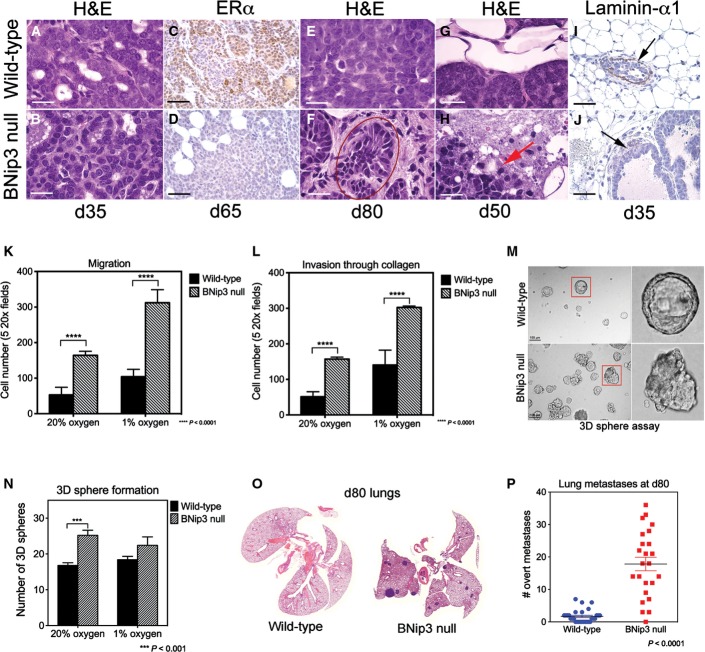
A, B Primary mammary tumors in BNip3 null mice at d35 showed increased nuclear grade (grade 3) compared to wild-type (grade 2).
C, D Expression of estrogen receptor-alpha (ER-α) at d65 shows reduced expression in BNip3 null tumors compared to wild-type.
E, F Increased pleomorphism and evidence of epithelial–mesenchymal transition (EMT) in BNip3 null tumors at d80 but not in wild-type.
G, H Loss of basement membrane integrity in BNip3 null tumors at d65 (indicated by the red arrow).
I, J Laminin-α1 staining confirms loss of basement membrane integrity in BNip3 null tumors at earlier stages than for wild-type (black arrows indicate laminin-α1-expressing basement membrane in wild-type and loss of basement membrane integrity in BNip3 null).
K, L Migration–invasion assays in Transwell assays, measured in triplicate. Quantification of invasion through collagen-coated Transwell inserts and migration across uncoated inserts for wild-type and BNip3 null MECs grown under 20% or 1% oxygen.
M, N Growth of wild-type and BNip3 null 3D spheres in Matrigel, measured in triplicate.
O, P Increased lung metastases at d80 in BNip3 null mice (n = 21) compared to wild-type (n = 24).
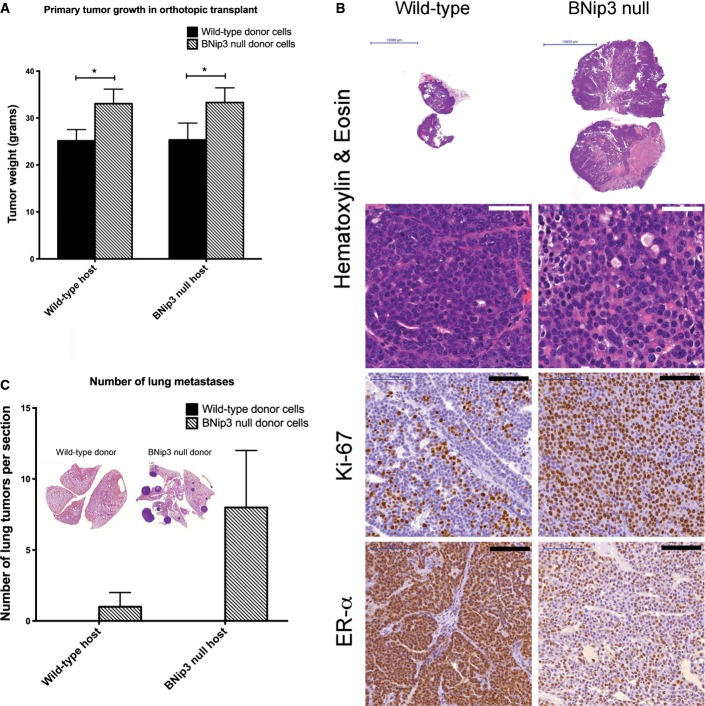
Weights of tumors forming from wild-type or BNip3 null MECs transplanted into the mammary fat pad of wild-type or BNip3 null host mice. Results are expressed as the mean ± SEM. *P < 0.05.
Histological analysis of tumors formed from wild-type or BNip3 null MECs following transplant into the mammary fat pad of wild-type mice. White scale bar is 50 μm. Black scale bar is 100 μm.
Quantification of lung metastases forming from wild-type or BNip3 null MECs transplanted into the mammary fat pad of wild-type or BNip3 null host mice. Results are expressed as the mean ± SEM.
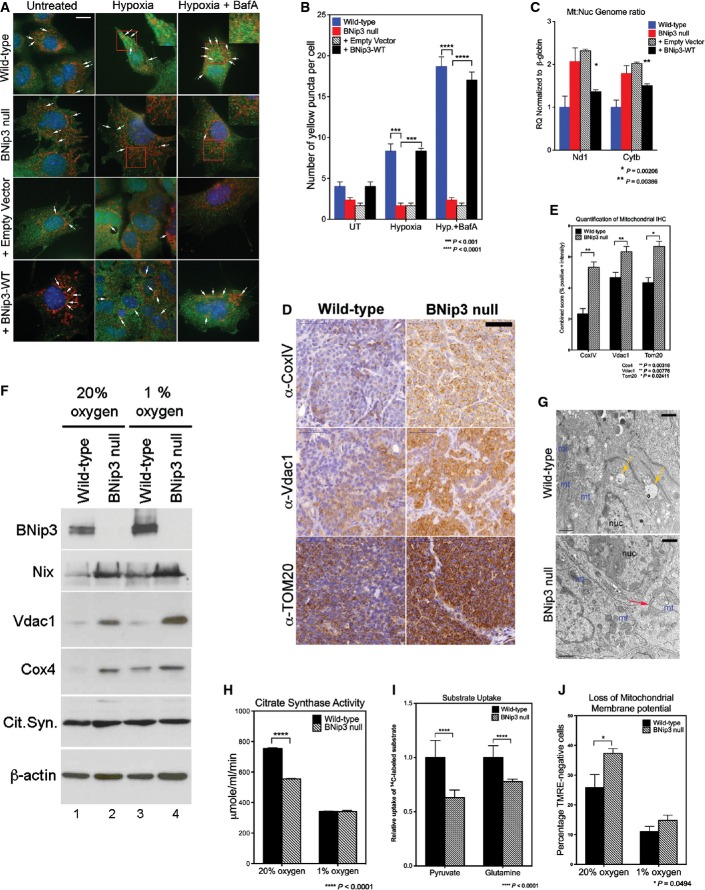
A, B Co-immunofluorescence for endogenous LC3B (green, autophagosomes) and cyclophilin D (red, mitochondria) to examine the levels of mitophagy in wild-type and BNip3 null MECs determined as the number of yellow puncta arising due to overlap of mitochondria and autophagosomes (indicated by white arrows). This was examined at 20% oxygen (untreated), 1% oxygen (hypoxia) and 1% oxygen + bafilomycin A1 (hypoxia + BafA) and in BNip3 null MECs expressing either empty vector control or exogenous BNip3. Scale bar is 20 μm. Quantification of number of yellow puncta (B) per 63 × field. n > 4 for all treatments.
C qPCR for mitochondrial genome-encoded Nd1 and Cytb standardized to nuclear-encoded β-globin in wild-type MECs, BNip3 null MECs, BNip3 null MECs expressing empty vector control or BNip3 null MECs expressing exogenous BNip3-WT for three independent experiments performed in 8 replicates each.
D, E Immunohistochemical staining for expression of cytochrome c oxidase-IV (CoxIV), voltage-dependent anion channel-1 (Vdac1) and TOM20 on sections from wild-type (n = 4) and BNip3 null (n = 4) tumors at d65 and quantified (E) using the Aperio system. Scale bar is 50 μm.
F Western blot analysis for expression of mitochondrial proteins in extracts from wild-type and BNip3 null MECs grown at 20% and 1% oxygen.
G Transmission electron micrographs of wild-type and BNip3 null primary tumors at d35 illustrating increased mitochondrial density (mt) in BNip3 null tumors compared to wild-type, altered structure (red arrow) and the presence of vesicles in wild-type tumors (yellow arrows). Scale bar is 1 μm.
H Citrate synthase activity assay as a measure of mitochondrial function on wild-type and BNip3 null MECs grown at 20% and 1% oxygen, measured in triplicate experiments.
I Measurement of uptake of 14C-labeled pyruvate or glutamine by wild-type and BNip3 null MECs, measured in triplicate experiments.
J Flow cytometric analysis of TMRE staining as a measure of mitochondrial membrane potential in wild-type and BNip3 null MECs grown at 20% and 1% oxygen, measured in triplicate experiments.
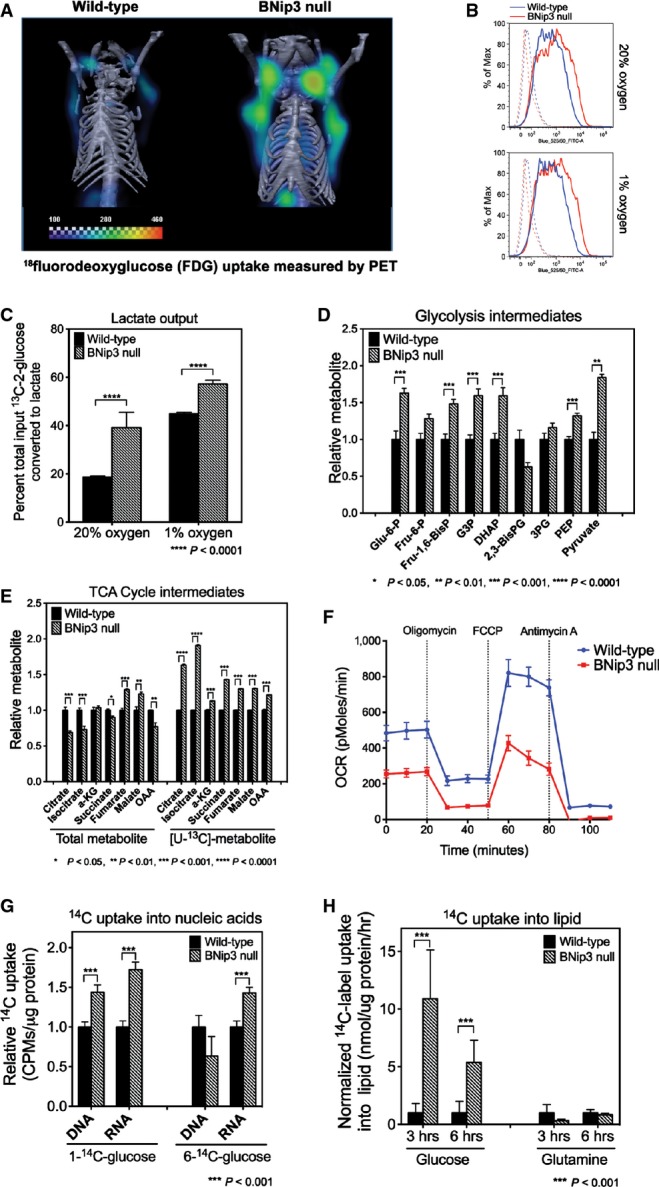
μPET/CT imaging of wild-type (n = 5) and BNip3 null (n = 5) mice at d50 following injection of mice with 18F-deoxyglucose to examine glucose uptake by tumors.
Flow cytometric measurement of fluorescent glucose uptake by wild-type and BNip3 null MECs grown in vitro at 20% and 1% oxygen.
Lactate output by wild-type and BNip3 null MECs grown at 20% and 1% oxygen was measured by NMR, performed in triplicate.
Mass spectrometric measurement of total levels of glycolytic intermediates (n = 4 for each genotype).
Mass spectrometric measurement of total levels of TCA cycle intermediates and of 13C-labeled intermediates after growth in [U13C]-glucose for 6 h (3 biological replicates and 3 experimental replicates).
Oxygen consumption using Seahorse XF96 by wild-type (blue) and BNip3 null (red) MECs (6 experimental replicates per point), performed in triplicate experiments.
Measurement of uptake of 14C-labeled glucose into nucleic acids in wild-type and BNip3 null MECs (performed twice in triplicate).
Measurement of uptake of 14C-labeled glucose or glutamine into lipid in wild-type and BNip3 null MECs (performed twice in triplicate).
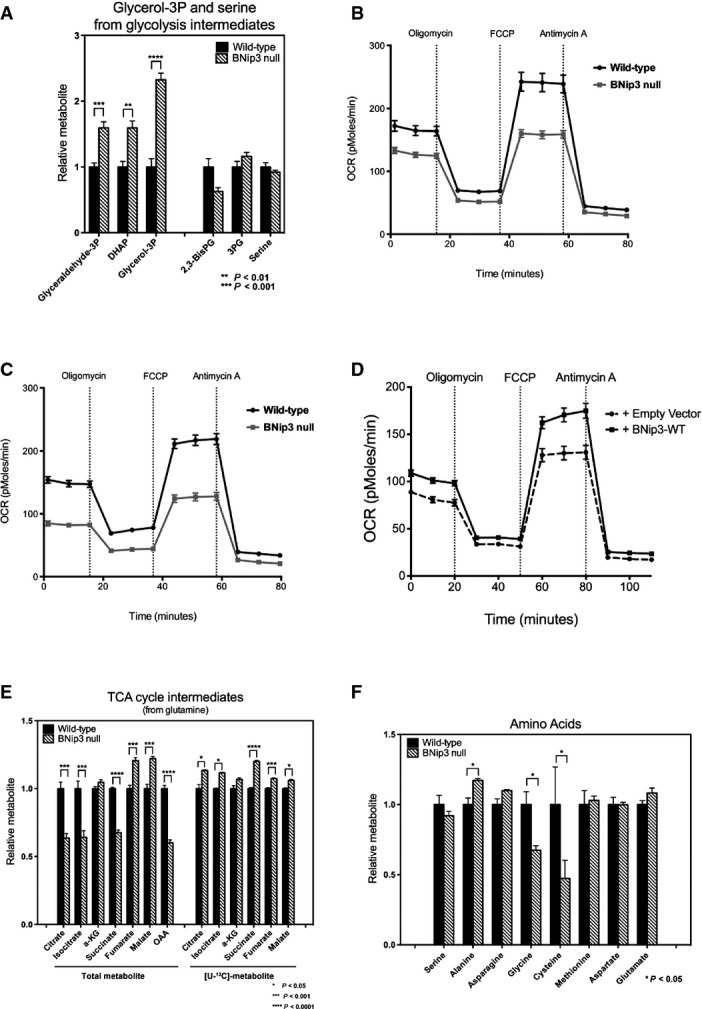
A Mass spectrometric measurement of total levels of glycerol-3-phosphate and serine plus the glycolytic intermediates from which they are generated.
B, C Oxygen consumption by wild-type and BNip3 null MECs grown in the presence of glutamine (B) or glucose plus glutamine (C).
D Oxygen consumption by BNip3 null MECs following expression of either empty vector (hashed line) or BNip3-expressing vector (solid line) (6 experimental replicates per point), performed in triplicate experiments.
E Mass spectrometric measurement of TCA cycle intermediates after 24 h of growth in [U-13C]-glutamine.
F Mass spectrometric measurement of total levels of amino acids in wild-type and BNip3 null MECs grown on glucose.
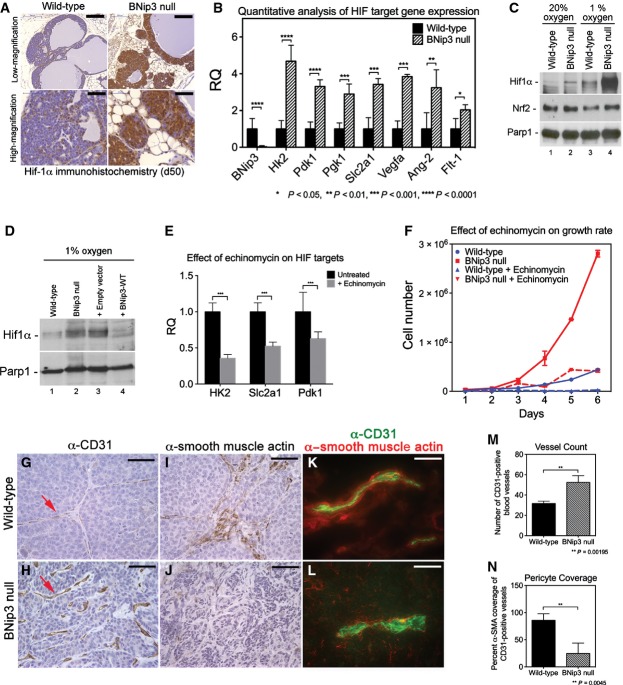
A Immunohistochemical staining for Hif-1α in wild-type (n = 4) and BNip3 null (n = 4) tumors at d50. Scale bar at low magnification is 200 μm. Scale bar at high magnification is 50 μm.
B qPCR for expression of key Hif target genes and other growth-related genes in tumors from wild-type and BNip3 null mice at d80 (n = 2 per genotype, performed in triplicate).
C Western blot for Hif-1α, Nrf-2 and Parp-1 on nuclear extracts from wild-type and BNip3 null MECs grown at 20% or 1% oxygen.
D Western blot for Hif-1α and Parp-1 on nuclear extracts from wild-type and BNip3 null MECs (lanes 1, 2), and on parental BNip3 null MECs expressing either empty control vector (+ Empty vector, lane 3) or BNip3-expressing vector (+ BNip3-WT, lane 4), all cultured at 1% oxygen.
E qPCR for key HIF target genes in BNip3 null MECs before and after treatment with 10 ng/ml echinomycin.
F Growth rate of primary wild-type (blue) and BNip3 null (red) MECs treated with 10 ng/ml echinomycin, measured in triplicate experiments.
G, H Immunohistochemical staining for CD31 on wild-type (n = 20) and BNip3 null (n = 20) tumors at d80. Scale bar is 25 μm.
I, J Immunohistochemical staining for α-SMA on wild-type (n = 20) and BNip3 null (n = 20) tumors at d80. Scale bar is 25 μm.
K, L Co-staining for CD31 and α-SMA on frozen sections of wild-type (n = 8) and BNip3 null (n = 8) tumors at d80. Scale bar is 10 μm.
M, N Quantification of vessel count (M) and pericyte coverage (N) in wild-type and BNip3 null tumors at d80.

Staining of frozen sections of wild-type and BNip3 null tumors at d35 for dihydroethidine (n = 4 for each genotype) and of FFPE sections for 8-hydroxyguanine (8-OHdG) at d80 (n = 4 for each genotype). Scale bar is 50 μm.
Quantification of staining for DHE and 8-OHdG presented in (A).
Flow cytometric analysis of mitochondrial ROS using MitoSOX fluorescent probe (n = 4 for each genotype).
Quantification of total levels of reduced and oxidized glutathione, glycine and cysteine in wild-type and BNip3 null tumor cells (3 biological replicates and 3 experimental replicates).
Effect of BHA diet supplementation on MMTV-PyMT tumor volume in wild-type (n = 12) and BNip3 null (n = 19) mice.
Immunohistochemical staining for Ki67 on wild-type and BNip3 null tumors at d80 having been fed regular chow or BHA-supplemented chow from d65 (n = 4 for each genotype and treatment).
Immunohistochemical staining for Hif-1α on BNip3 null tumors at d80 having been fed regular chow or BHA-supplemented chow from d65 (n = 4 for each treatment). Scale bar is 100 μm.
qPCR for expression of key Hif target genes and other growth-related genes in tumors from wild-type and BNip3 null mice at d80 having been fed regular chow or BHA-supplemented chow from d65 (performed in triplicate).
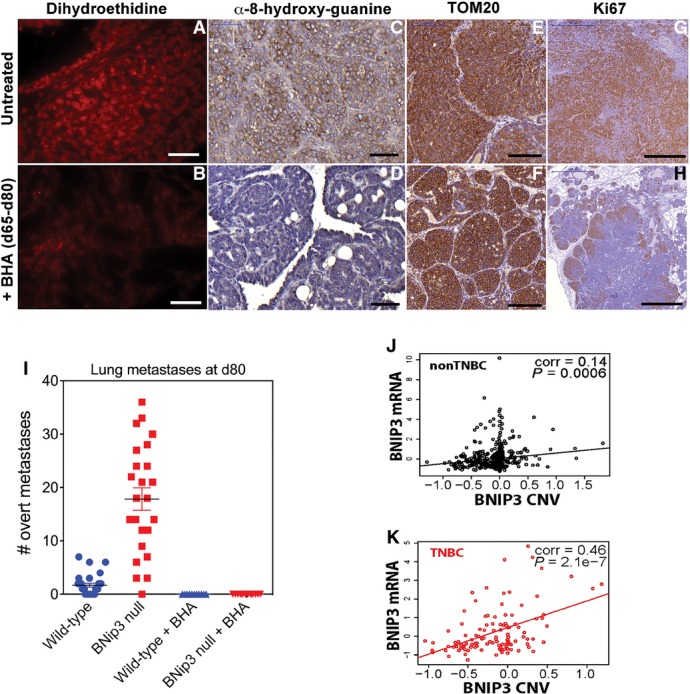
A, B Staining with dihydroethidine for superoxide levels in situ on BNip3 null tumor sections at d80 following supplementation of mouse diet with BHA (B) or not (A). Scale bars are 50 μm.
C, D Immunohistochemical staining for 8-hydroxyguanine to assess effects of BHA diet (D) on levels of ROS in tumors from BNip3 null mice compared to untreated BNip3 null mice (C). Scale bars are 50 μm.
E, F Immunohistochemical staining for TOM20 to assess effects of BHA diet (F) on mitochondrial mass in tumors from BNip3 null mice compared to untreated BNip3 null mice (E). Scale bars are 100 μm.
G, H Immunohistochemical staining for Ki67 to assess the effects of BHA diet (H) on tumor cell proliferation in tumors from BNip3 null mice compared to untreated BNip3 null mice (G). Scale bars are 500 μm.
I Metastasis numbers in serial sections of lungs from wild-type or BNip3 null mice sacrificed at d80 either untreated or treated with BHA diet from d65–d80. Wild-type/UT, n = 21; BNip3 null/UT, n = 24; Wild-type/BHA, n = 11; BNip3 null/BHA, n = 14.
J RNAseq-derived mRNA expression levels of BNip3 correlated with chromosomal copy number variation of BNip3 in non-TNBC samples of TCGA breast cancer cohort (n = 576).
K RNAseq-derived mRNA expression levels of BNip3 in TNBC correlated with chromosomal copy number variation of BNip3 in TNBC samples of the TCGA breast cancer cohort (n = 113).
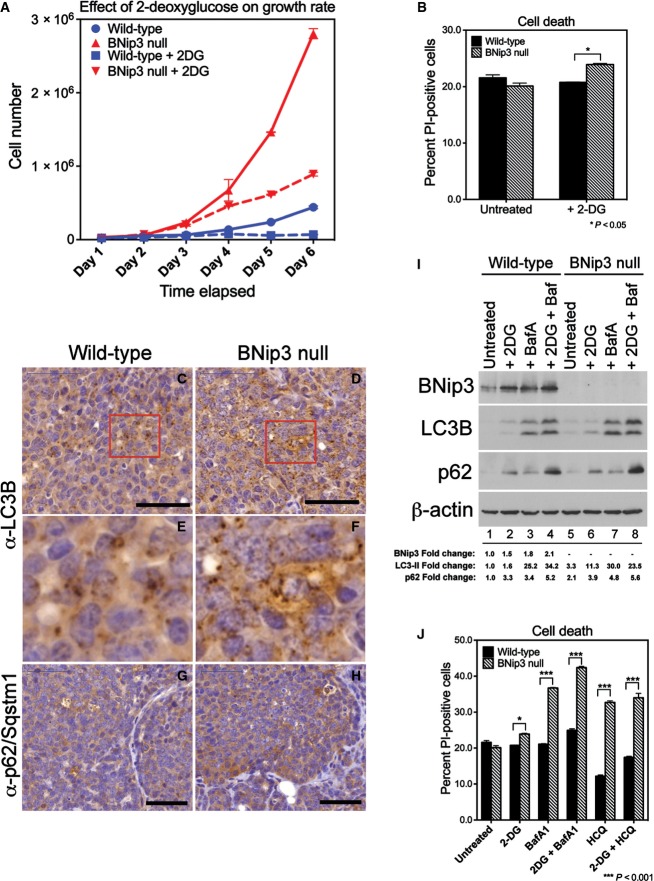
A Effect of inhibiting glycolysis with 2-deoxyglucose for the growth rate of wild-type and BNip3 null MECs grown at 20% oxygen (performed in triplicate).
B Measurement of cell death measured by flow cytometric quantification of propidium iodide uptake in the presence or absence of 2-deoxyglucose.
C–H Immunohistochemical staining for LC3B (C–F) and p62/sqstm1 (G, H) on sections of wild-type (C, E, G; n = 4) and BNip3 null (D, F, H; n = 4) tumors at d80. Black scale bar is 50 μm. Red cut-out box in (C) and (D) is presented in (E) and (F), respectively.
I Western blot analysis of levels of BNip3, processed LC3B, p62/Sqstm1 and β-actin (loading control) in the presence or absence of 2-deoxyglucose or bafilomycin A1. Band intensity was calculated using ImageJ and standardized to the intensity of the loading control (β-actin). Fold change was determined relative to wild-type values in lane 1 for each protein measured.
J Measurement of cell death analyzed by flow cytometric quantification of propidium iodide uptake in the presence or absence of bafilomycin A1, hydroxychloroquine and/or 2-deoxyglucose, performed in duplicate experiments.
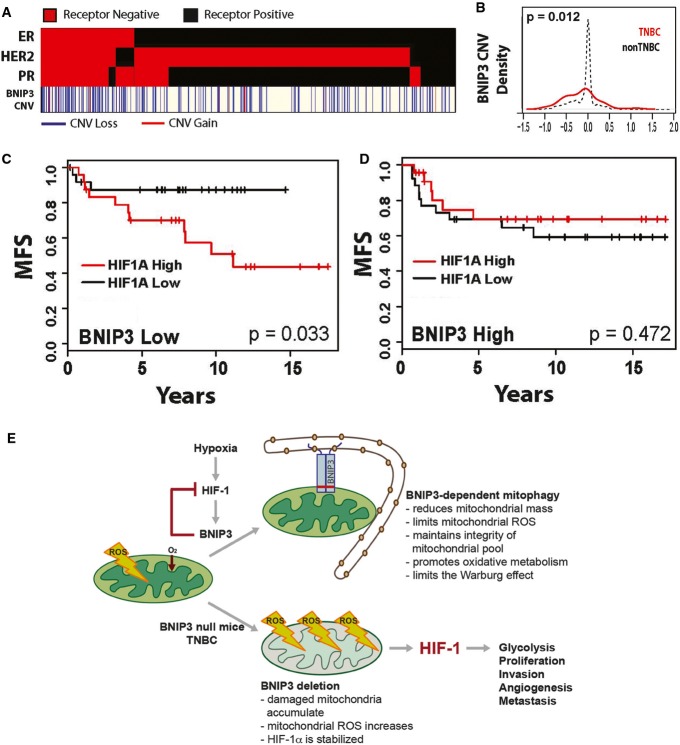
Hormone receptor status (red = positive, black = negative) and chromosomal copy number variation (CNV, as defined by the GISTIC algorithm) of BNip3 (red = gain greater than or equal to 1, blue = loss less than or equal to −1, white = unchanged) from n = 689 patient samples in The Cancer Genome Atlas (TCGA) breast cohort where status is unambiguously assigned for all three hormone receptors and copy number data are available and assigned by the GISTIC algorithm.
Relative frequency of copy number variation (CNV) of BNip3 in triple-negative breast cancer (TNBC; red, n = 113) and non-TNBC (black, n = 576) in TCGA breast cohort.
TNBC patient metastasis-free survival in low-BNip3-expressing patients (below median, n = 51) stratified by high (above median) and low (below median) expressing Hif-1α.
TNBC patient metastasis-free survival in high-BNip3-expressing patients (above median, n = 50) stratified by high (above median) and low (below median) expressing Hif-1α.
Schematic summary of the role of BNIP3 in suppressing tumor progression and metastasis.
Similar articles
-
Roles of HIF-1α/BNIP3 mediated mitophagy in mitochondrial dysfunction of letrozole-induced PCOS rats.J Mol Histol. 2022 Oct;53(5):833-842. doi: 10.1007/s10735-022-10096-4. Epub 2022 Aug 11. J Mol Histol. 2022. PMID: 35951252
-
HIF-1α-BNIP3-mediated mitophagy in tubular cells protects against renal ischemia/reperfusion injury.Redox Biol. 2020 Sep;36:101671. doi: 10.1016/j.redox.2020.101671. Epub 2020 Aug 7. Redox Biol. 2020. PMID: 32829253 Free PMC article.
-
The evolutionarily conserved hif-1/bnip3 pathway promotes mitophagy and mitochondrial fission in crustacean testes during hypoxia.Am J Physiol Regul Integr Comp Physiol. 2023 Jan 1;324(1):R128-R142. doi: 10.1152/ajpregu.00212.2022. Epub 2022 Dec 5. Am J Physiol Regul Integr Comp Physiol. 2023. PMID: 36468826
-
Tumor suppressor functions of BNIP3 and mitophagy.Autophagy. 2015;11(10):1937-8. doi: 10.1080/15548627.2015.1085136. Autophagy. 2015. PMID: 26315353 Free PMC article. Review.
-
Role of BNIP3 and NIX in cell death, autophagy, and mitophagy.Cell Death Differ. 2009 Jul;16(7):939-46. doi: 10.1038/cdd.2009.16. Epub 2009 Feb 20. Cell Death Differ. 2009. PMID: 19229244 Free PMC article. Review.
Cited by
-
Mitophagy pathways in health and disease.J Cell Biol. 2020 Nov 2;219(11):e202004029. doi: 10.1083/jcb.202004029. J Cell Biol. 2020. PMID: 32926082 Free PMC article. Review.
-
ADT-OH exhibits anti-metastatic activity on triple-negative breast cancer by combinatorial targeting of autophagy and mitochondrial fission.Cell Death Dis. 2024 Jun 28;15(6):463. doi: 10.1038/s41419-024-06829-w. Cell Death Dis. 2024. PMID: 38942765 Free PMC article.
-
The Role of Autophagy in Human Uveal Melanoma and the Development of Potential Disease Biomarkers and Novel Therapeutic Paradigms.Biomedicines. 2024 Feb 19;12(2):462. doi: 10.3390/biomedicines12020462. Biomedicines. 2024. PMID: 38398064 Free PMC article. Review.
-
The Role of Mitochondrial Dynamics and Mitophagy in Carcinogenesis, Metastasis and Therapy.Front Cell Dev Biol. 2020 Jun 10;8:413. doi: 10.3389/fcell.2020.00413. eCollection 2020. Front Cell Dev Biol. 2020. PMID: 32587855 Free PMC article. Review.
-
Parkin and mitophagy in cancer.Oncogene. 2017 Mar;36(10):1315-1327. doi: 10.1038/onc.2016.302. Epub 2016 Sep 5. Oncogene. 2017. PMID: 27593930 Review.
References
Publication types
MeSH terms
Substances
Grants and funding
LinkOut - more resources
Full Text Sources
Other Literature Sources
Molecular Biology Databases
