(13)C-metabolic flux analysis of co-cultures: A novel approach
- PMID: 26219674
- PMCID: PMC5897767
- DOI: 10.1016/j.ymben.2015.07.005
(13)C-metabolic flux analysis of co-cultures: A novel approach
Abstract
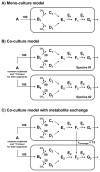
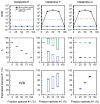
In this work, we present a novel approach for performing (13)C metabolic flux analysis ((13)C-MFA) of co-culture systems. We demonstrate for the first time that it is possible to determine metabolic flux distributions in multiple species simultaneously without the need for physical separation of cells or proteins, or overexpression of species-specific products. Instead, metabolic fluxes for each species in a co-culture are estimated directly from isotopic labeling of total biomass obtained using conventional mass spectrometry approaches such as GC-MS. In addition to determining metabolic fluxes, this approach estimates the relative population size of each species in a mixed culture and inter-species metabolite exchange. As such, it enables detailed studies of microbial communities including species dynamics and interactions between community members. The methodology is experimentally validated here using a co-culture of two E. coli knockout strains. Taken together, this work greatly extends the scope of (13)C-MFA to a large number of multi-cellular systems that are of significant importance in biotechnology and medicine.
Keywords: Isotopic tracers; Metabolic flux analysis; Microbial communities; Microbial consortia; Multi-organism systems.
Copyright © 2015 International Metabolic Engineering Society. Published by Elsevier Inc. All rights reserved.
Figures


Similar articles
-
13C metabolic flux analysis of microbial and mammalian systems is enhanced with GC-MS measurements of glycogen and RNA labeling.Metab Eng. 2016 Nov;38:65-72. doi: 10.1016/j.ymben.2016.06.007. Epub 2016 Jun 22. Metab Eng. 2016. PMID: 27343680 Free PMC article.
-
Optimal tracers for parallel labeling experiments and 13C metabolic flux analysis: A new precision and synergy scoring system.Metab Eng. 2016 Nov;38:10-18. doi: 10.1016/j.ymben.2016.06.001. Epub 2016 Jun 4. Metab Eng. 2016. PMID: 27267409 Free PMC article.
-
Comprehensive analysis of glucose and xylose metabolism in Escherichia coli under aerobic and anaerobic conditions by 13C metabolic flux analysis.Metab Eng. 2017 Jan;39:9-18. doi: 10.1016/j.ymben.2016.11.003. Epub 2016 Nov 11. Metab Eng. 2017. PMID: 27840237 Free PMC article.
-
13C metabolic flux analysis: optimal design of isotopic labeling experiments.Curr Opin Biotechnol. 2013 Dec;24(6):1116-21. doi: 10.1016/j.copbio.2013.02.003. Epub 2013 Feb 28. Curr Opin Biotechnol. 2013. PMID: 23453397 Review.
-
Parallel labeling experiments for pathway elucidation and (13)C metabolic flux analysis.Curr Opin Biotechnol. 2015 Dec;36:91-7. doi: 10.1016/j.copbio.2015.08.014. Epub 2015 Aug 28. Curr Opin Biotechnol. 2015. PMID: 26322734 Review.
Cited by
-
Model validation and selection in metabolic flux analysis and flux balance analysis.Biotechnol Prog. 2024 Jan-Feb;40(1):e3413. doi: 10.1002/btpr.3413. Epub 2023 Nov 24. Biotechnol Prog. 2024. PMID: 37997613 Free PMC article. Review.
-
Understanding and Engineering Distributed Biochemical Pathways in Microbial Communities.Biochemistry. 2019 Jan 15;58(2):94-107. doi: 10.1021/acs.biochem.8b01006. Epub 2018 Nov 20. Biochemistry. 2019. PMID: 30457843 Free PMC article. Review.
-
Synthetic microbial consortia for biosynthesis and biodegradation: promises and challenges.J Ind Microbiol Biotechnol. 2019 Oct;46(9-10):1343-1358. doi: 10.1007/s10295-019-02211-4. Epub 2019 Jul 5. J Ind Microbiol Biotechnol. 2019. PMID: 31278525 Review.
-
Microbial model communities: To understand complexity, harness the power of simplicity.Comput Struct Biotechnol J. 2020 Dec 2;18:3987-4001. doi: 10.1016/j.csbj.2020.11.043. eCollection 2020. Comput Struct Biotechnol J. 2020. PMID: 33363696 Free PMC article. Review.
-
Investigating metabolic interactions in a microbial co-culture through integrated modelling and experiments.Comput Struct Biotechnol J. 2020 Mar 30;18:1249-1258. doi: 10.1016/j.csbj.2020.03.019. eCollection 2020. Comput Struct Biotechnol J. 2020. PMID: 32551031 Free PMC article.
References
-
- Antoniewicz MR. Methods and advances in metabolic flux analysis: a mini-review. J Ind Microbiol Biotechnol. 2015;42:317–325. - PubMed
-
- Antoniewicz MR. Dynamic metabolic flux analysis--tools for probing transient states of metabolic networks. Curr Opin Biotechnol. 2013;24:973–8. - PubMed
-
- Antoniewicz MR, Kelleher JK, Stephanopoulos G. Accurate assessment of amino acid mass isotopomer distributions for metabolic flux analysis. Anal Chem. 2007a;79:7554–9. - PubMed
Publication types
MeSH terms
Substances
Grants and funding
LinkOut - more resources
Full Text Sources
Other Literature Sources
Research Materials
Miscellaneous

