. 2015 Sep 4;290(36):22212-24.
doi: 10.1074/jbc.M115.644823. Epub 2015 Jul 24.

Interleukin-1 Receptor Type 2 Acts with c-Fos to Enhance the Expression of Interleukin-6 and Vascular Endothelial Growth Factor A in Colon Cancer Cells and Induce Angiogenesis

Affiliations

Interleukin-1 Receptor Type 2 Acts with c-Fos to Enhance the Expression of Interleukin-6 and Vascular Endothelial Growth Factor A in Colon Cancer Cells and Induce Angiogenesis

Ai-Chung Mar et al. J Biol Chem. .

Abstract

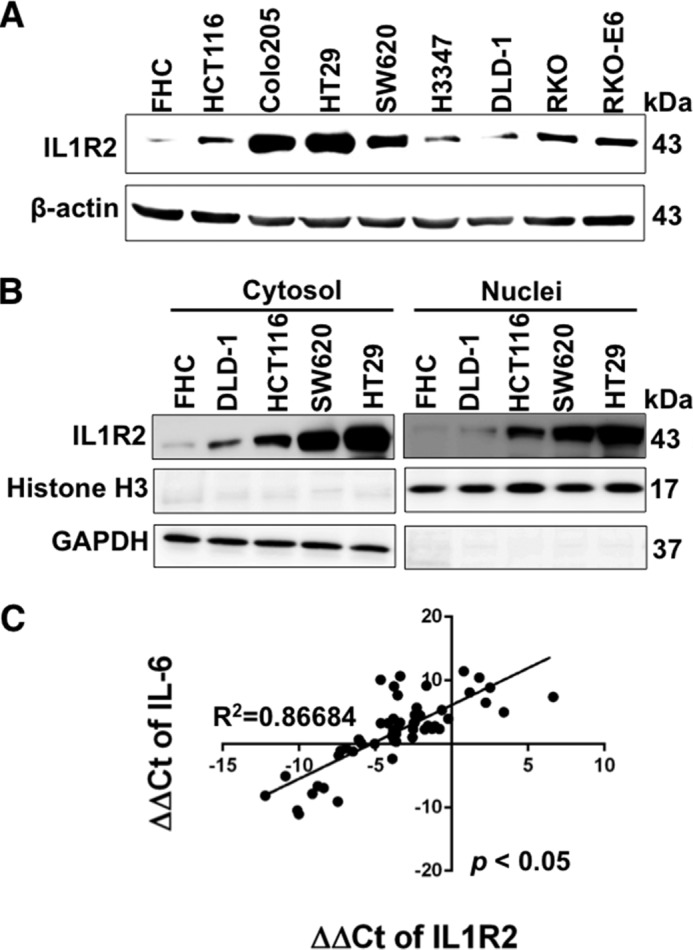
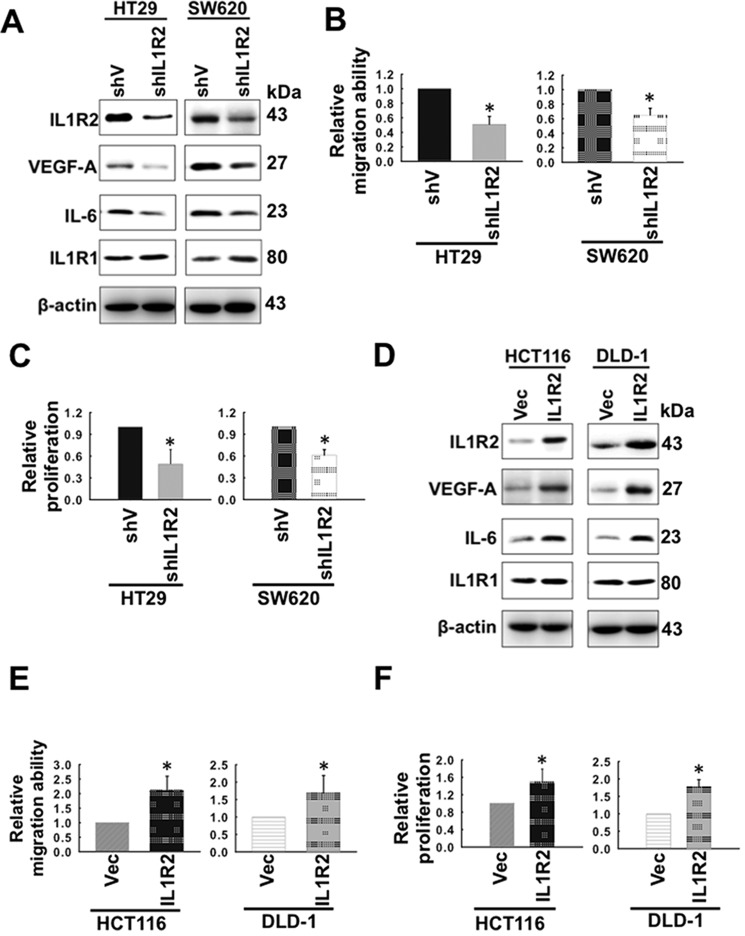
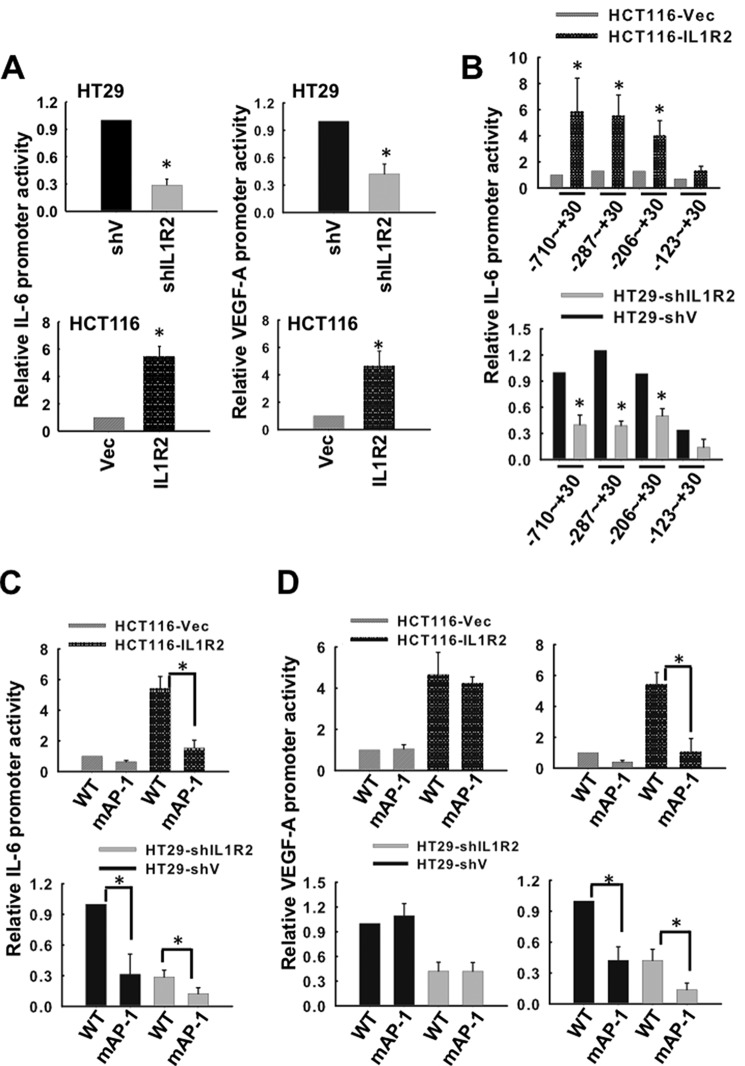
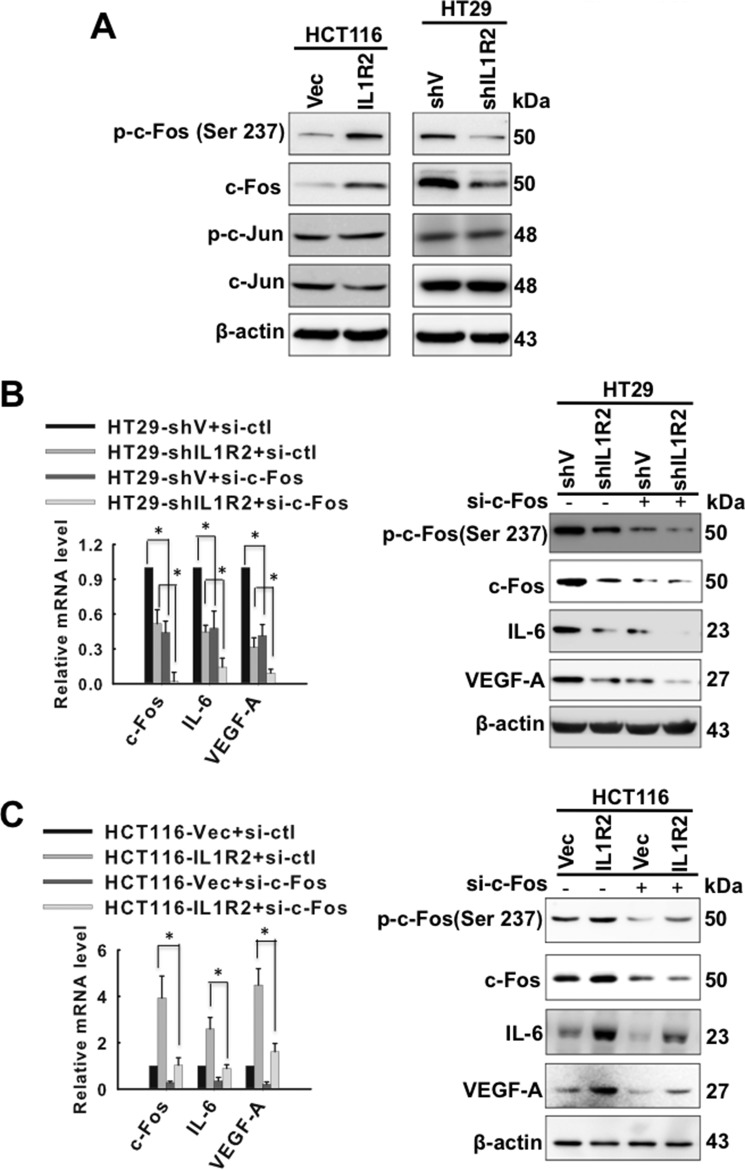
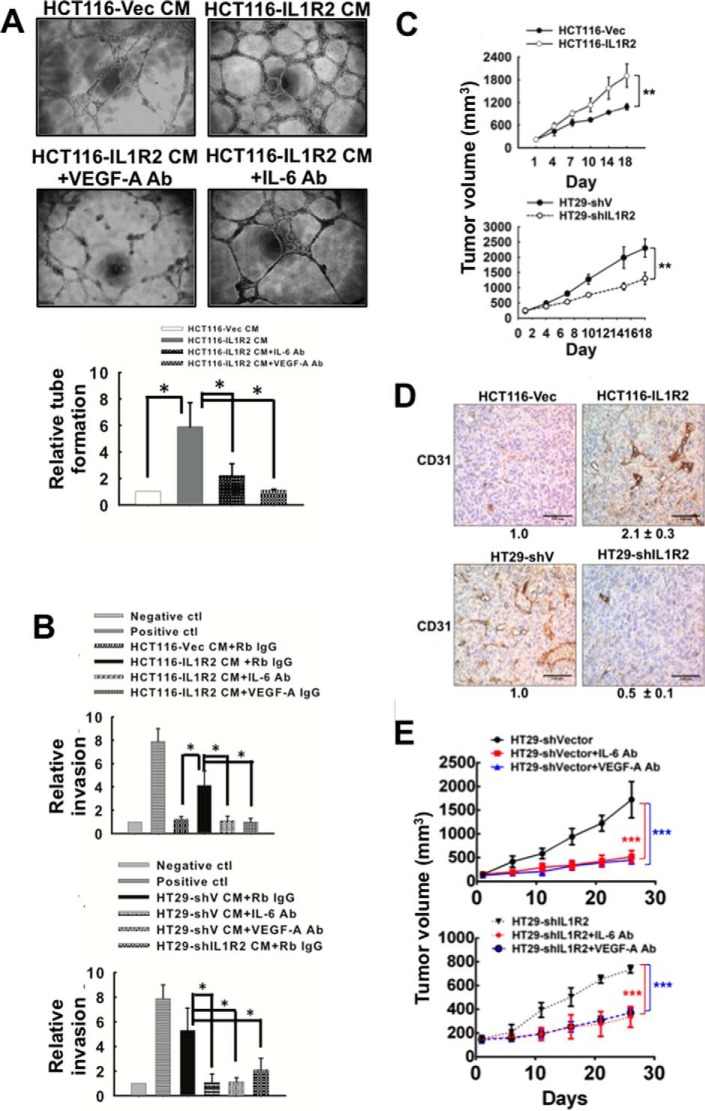
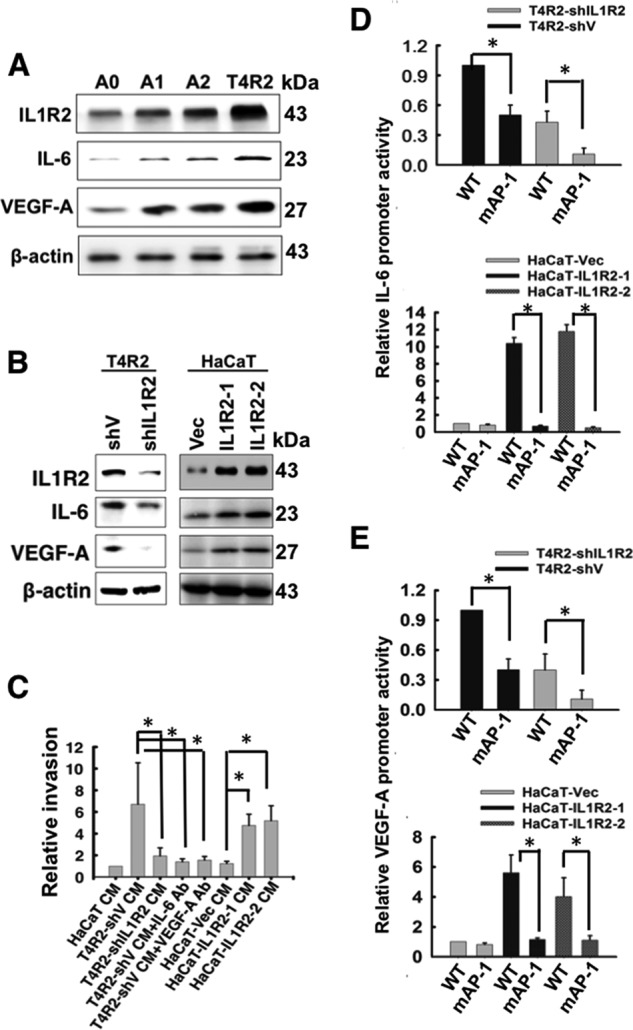
Interleukin-1 receptor type 2 (IL1R2) acts as a decoy receptor of exogenous IL-1; however, its intracellular activity is poorly understood. We previously demonstrated that IL1R2 intracellularly activates the expression of several proinflammatory cytokines and affects cell migration. In this study, we found that intracellular IL1R2 expression was increased in human colorectal cancer cells (CRCs) compared with normal colon cells. We also observed that the mRNA levels of IL1R2 were highly correlated with IL-6 in tumor tissues of CRC patients. By modulating its expression in CRC cells, we verified that enhanced IL1R2 expression transcriptionally activated the expression of IL-6 and VEGF-A. Conditioned medium harvested from IL1R2-overexpressing CRC cells contained higher levels of IL-6 and VEGF-A than that from vector control cells and significantly enhanced the proliferation, migration, and tube formation of cultured endothelial cells. We further demonstrated a positive association of intracellular IL1R2 levels with tumor growth and microvessel density in xenograft mouse models. These results revealed that IL1R2 activates the expression of angiogenic factors. Mechanistically, we revealed that IL1R2 complexes with c-Fos and binds to the AP-1 site at the IL-6 and VEGF-A promoters. Together, these results reveal a novel function of intracellular IL1R2 that acts with c-Fos to enhance the transcription of IL-6 and VEGF-A, which promotes angiogenesis in CRC.

Keywords: angiogenesis; c-Fos; colon cancer; interleukin 6 (IL-6); interleukin-1 receptor type 2; vascular endothelial growth factor (VEGF).


Figures

FIGURE 1.
FIGURE 1.
IL1R2 expression is higher in human CRC cells than normal colon epithelial cells and correlates well with IL-6 mRNA levels in tumor tissues of CRC patient. A, the IL1R2 protein levels in normal colon cells (FHC) and eight human CRC cell lines were measured by Western blot analysis. β-Actin served as a loading control. B, the nuclear and cytosolic IL1R2 in FHC and CRC cells was examined by Western blotting. GAPDH served as the loading control for the cytosolic fraction and histone H3 for the nuclear fraction. The Western blots (A and B) were independently repeated at least three times, and representative data are shown. C, correlation between the expression of IL1R2 and IL-6 mRNA (ΔΔCt indicates ΔCt of target gene − ΔCt of GAPDH) in CRC patients. The correlation between IL1R2 and IL-6 was analyzed using the χ2 test.
FIGURE 2.
FIGURE 2.
Intracellular IL1R2 modulates the expression of IL-6 and VEGF-A and the migration and proliferation of CRC cells. A, the IL1R2, IL1R1, IL-6, and VEGF-A protein levels in HT29-shV, HT29-shIL1R2, SW620-shV, and SW620-shIL1R2 cells were analyzed by Western blotting. β-Actin served as a loading control. The results shown are representative of three independent experiments with similar results. B, the migration abilities of HT29-shV, HT29-shIL1R2, SW620-shV, and SW620-shIL1R2 cells were analyzed by Transwell migration assays as described under “Experimental Procedures.” C, the proliferation of HT29-shV, HT29-shIL1R2, SW620-shV, and SW620-shIL1R2 cells was analyzed by seeding 2 × 10⁴ cells in each well of 12-well dishes and cultured for 96 h in 10% FCS-containing medium. The cell number was determined using a cell counter after staining with trypan blue. D, the IL1R2, IL-6, IL1R1, and VEGF-A protein levels in HCT116-Vec, HCT116-IL1R2, DLD-1-Vec, and DLD-1-IL1R2 cells were analyzed by Western blotting. β-Actin served as a loading control. The results shown are representative of three independent experiments with similar results. E, the migration abilities of HCT116-Vec, HCT116-IL1R2, DLD-1-Vec, and DLD-1-IL1R2 cells were determined by Transwell migration assays as described under “Experimental Procedures.” F, the proliferation of HCT116-Vec, HCT116-IL1R2, DLD-1-Vec, and DLD-1-IL1R2 cells was determined by trypan blue assay as described in C. The Western blots were independently repeated at least three times, and the representative data are shown. The proliferation and the migration assays were performed in triplicate. The data shown are means ± S.D. of three independent experiments. *, p < 0.05 by Student's t test.
FIGURE 3.
FIGURE 3.
The AP-1 transcription factor is involved in the IL1R2-dependent increase in IL-6 and VEGF-A promoter activity. A, HT29-shV, HT29-shIL1R2, HCT116-Vec, and HCT116-IL1R2 cells were co-transfected with plasmids containing the firefly luciferase gene driven by the IL-6 or VEGF-A promoter and a Renilla control vector for 24 h. The activities of the IL-6 and VEGF-A promoters were measured as described under “Experimental Procedures.” B, plasmids containing the luciferase reporter driven by serially truncated IL-6 promoters were transiently co-transfected with a Renilla control vector into HT29-shV, HT29-shIL1R2, HCT116-Vec, and HCT116-IL1R2 cells. Dual luciferase assays were performed 24 h post-transfection. C and D, HT29-shV, HT29-shIL1R2, HCT116-Vec, and HCT116-IL1R2 cells were co-transfected with a Renilla control vector and plasmids containing the firefly luciferase gene driven by an AP-1 binding site-mutated IL-6 promoter (C) and VEGF-A promoter mutated at −1527∼−1521 (D, left panels) or mutated at −621∼−615 (D, right panels). The promoter activities of the mutated IL-6 and VEGF-A promoters were determined 24 h post-transfection. The data of relative promoter activity are means ± S.D. of three independent experiments. *, p < 0.05 by Student's t test.
FIGURE 4.
FIGURE 4.
IL1R2 activates c-Fos to enhance the expression of IL-6 and VEGF-A. A, the p-c-Fos (Ser 237), c-Fos, p-c-Jun (Ser-63), and c-Jun protein levels in HT29-shV, HT29-shIL1R2, HCT116-Vec, and HCT116-IL1R2 cells were analyzed by Western blotting. β-Actin served as a loading control. B and C, the mRNA and protein levels of c-Fos, IL-6, and VEGF-A were determined using qPCR and Western blot analysis, respectively, in HT29-shV and HT29-shIL1R2 cells (B) as well as in HCT116-Vec and HCT116-IL1R2-2 cells (C) after c-Fos was knocked down by siRNA transfection. The Western blots were independently repeated at least three times, and the representative data are shown. The data of mRNA levels are means ± S.D. of three independent experiments. *, p < 0.05 by Student's t test.
FIGURE 5.
FIGURE 5.
IL1R2 forms a complex with c-Fos and activates the IL-6 and VEGF-A promoters. A, total lysates of HCT116-Vec and HCT116-IL1R2 cells (left column), as well as HT29-shV and HT29-shIL1R2 cells (right column), were immunoprecipitated using 5 μg of anti-c-Fos (upper panel) or anti-IL1R2 antibodies (lower panel), and Western blotting was performed using the indicated antibodies. B, the extracts of HCT116 cells that had expressed Myc-tagged full-length IL1R2 or its truncated mutant were subjected to immunoprecipitation with 5 μg of anti-Myc tag antibody followed by Western blot with anti-c-Fos or anti-Myc tag antibody. C, the protein lysates of HCT116 cells expressing Myc-tagged full-length IL1R2 or its truncated mutant were harvested and subjected for Western blotting using the indicated antibodies. D, ChIP was performed as follows. Crude lysates from HT29-shV, HT29-shIL1R2, HCT116-Vec, and HCT116-IL1R2 cells were immunoprecipitated using 5 μg of anti-c-Fos, anti-IL1R2, or rabbit IgG and then captured with protein A-agarose beads. The precipitated DNA samples were amplified by PCR to detect a fragment in the IL-6 (upper panel) or VEGF-A (lower panel) promoter containing the AP-1 binding site. The results shown are representative of three independent experiments with similar results. IB, immunoblot; IP, immunoprecipitation.
FIGURE 6.
FIGURE 6.
CM harvested from IL1R2-overexpressing cells is enriched with IL-6 and VEGF. A, ELISA was used to measure the IL-6 and VEGF-A levels in the serum-free CM harvested from CRC cells with modulated IL1R2 expression. The protein levels are means ± S.D. of three independent experiments. *, p < 0.05 by Student's t test. B and C, the proliferation (B) and migration (C) of EA.hy926 cells were analyzed using 3-(4,5-dimethylthiazol-2-yl)-2,5-diphenyl tetrazolium bromide (48 h, 10% FCS-containing CM) and Transwell migration assays (8 h, serum-free CM in the upper chamber and 5% FCS-containing medium in the lower chamber), respectively, after incubation in CM (with or without anti-IL-6 (2 μg/ml), anti-VEGF-A (2 μg/ml), or rabbit IgG control (2 μg/ml)) harvested from HT29-shV, HT29-shIL1R2, HCT116-Vec, and HCT116-IL1R2 cells. The data of relative proliferation and migration ability are means ± S.D. of three independent experiments. *, p < 0.05 by Student's t test.
FIGURE 7.
FIGURE 7.
CM harvested from IL1R2-overexpressing cells enhance angiogenicity of endothelial cells. A, CM (1% FCS) was harvested from HCT116-CMV22 and HCT116-IL1R2 cells. EA.hy926 cells (5 × 10⁴) in CM with or without rabbit IgG (2 μg/ml), anti-IL-6 (2 μg/ml), or anti-VEGF-A (2 μg/ml) were seeded in 96-well plates containing Matrigel, and their tube formation ability was examined after 24 h of incubation. The relative tube formation is the mean ± S.D. of three independent experiments. *, p < 0.05 by Student's t test. B, serum-free CM harvested from IL1R2-overexpressing cells enhanced angiogenesis in the DIVAA model. For DIVAA, mice were implanted with silicone tubes containing Matrigel and supplemented with angiogenic factors (100 ng of VEGF and FGF) as positive control or CM (with or without rabbit IgG, anti-IL-6, or anti-VEGF-A antibodies) harvested from HT29-shV, HT29-shIL1R2, HCT116-Vec, and HCT116-IL1R2 cells (n = 6 for each group). Neovascularization in the angioreactors was quantified using a spectrofluorometer 17 days after implantation. The relative invasion is the mean ± S.D. *, p < 0.05 by Student's t test. C, xenograft growth of HT29-shV, HT29-shIL1R2, HCT116-Vec, and HCT116-IL1R2 cells was evaluated in nude mice. Two million cells were subcutaneously inoculated into nude mice (n = 6 for each group). The tumor size (mean ± S.D.) was measured every 3 days. Two-way analysis of variance was performed by GraphPad Prism. **, p < 0.01. D, blood vessels in tumor were visualized by immunohistochemical staining with an antibody against CD31. Tumors formed by HT29-shV, HT29-shIL1R2, HCT116-Vec, and HCT116-IL1R2 cells were fixed, sectioned, and stained. CD31 staining is indicated in brown, and cell nuclei are blue. Total DAB staining was quantified by pixel density analysis using ImageJ software. The data are the averages of six tumors obtained from Fig. 7C (three locations were captured randomly in each tumor). E, the tumor growth of HT29-shV and HT29-shIL1R2 cells in nude mice (n = 5 for each group) was suppressed by intratumoral injection of an IL-6-neutralizing antibody or a VEGF-A-neutralizing antibody (50 μg, twice a week). The IgG antibody was used as control. The data are means ± S.D. Two-way analysis of variance was performed by GraphPad Prism. ***, p < 0.001.
FIGURE 8.
FIGURE 8.
The roles of IL1R2, IL-6, and VEGF-A in A0, A2, and T4R2 cells. A, the protein levels of IL1R2, IL-6, and VEGF-A in A0, A1, A2, and T4R2 cells were analyzed by Western blotting. β-Actin served as a loading control. B, the protein levels of IL1R2, IL-6, and VEGF-A in T4R2-shV, T4R2-shIL1R2, HaCaT-Vec, HaCaT-IL1R2-1, and HaCaT-IL1R2-2 cells were analyzed by Western blotting. C, DIVAA assay was performed as described for Fig. 7B. The CM was harvested from T4R2-shV, T4R2-shIL1R2, HaCaT-Vec, HaCaT-IL1R2-1, and HaCaT-IL1R2-2 cells. D and E, a luciferase assay was used to analyze the activity of wild-type or mutant IL-6 and VEGF-A promoter in T4R2-shV and T4R2-shIL1R2 cells (D) and HaCaT-Vec, HaCaT-IL1R2-1 and HaCaT-IL1R2-2 cells (E). The Western blots were independently repeated at least three times, and the representative data are shown. The relative invasion and promoter activity are means ± S.D. of three independent experiments. *, p < 0.05 by Student's t test.

Similar articles

Cited by

References

    1. Hanahan D., Weinberg R. A. (2011) Hallmarks of cancer: the next generation. Cell 144, 646–674 - PubMed
    1. Nishida N., Yano H., Nishida T., Kamura T., Kojiro M. (2006) Angiogenesis in cancer. Vasc. Health Risk Manag. 2, 213–219 - PMC - PubMed
    1. Jackson J. R., Seed M. P., Kircher C. H., Willoughby D. A., Winkler J. D. (1997) The codependence of angiogenesis and chronic inflammation. FASEB J. 11, 457–465 - PubMed
    1. Landskron G., De la Fuente M., Thuwajit P., Thuwajit C., Hermoso M. A. (2014) Chronic inflammation and cytokines in the tumor microenvironment. J. Immunol. Res. 2014, 149185. - PMC - PubMed
    1. Eldesoky A., Shouma A., Mosaad Y., Elhawary A. (2011) Clinical relevance of serum vascular endothelial growth factor and interleukin-6 in patients with colorectal cancer. Saudi J. Gastroenterol. 17, 170–173 - PMC - PubMed

Publication types

MeSH terms

Substances

LinkOut - more resources