

Quantitative Micro-Computed Tomography Imaging of Vascular Dysfunction in Progressive Kidney Diseases
- PMID: 26195818
- PMCID: PMC4724942
- DOI: 10.1681/ASN.2015020204
Quantitative Micro-Computed Tomography Imaging of Vascular Dysfunction in Progressive Kidney Diseases
Abstract
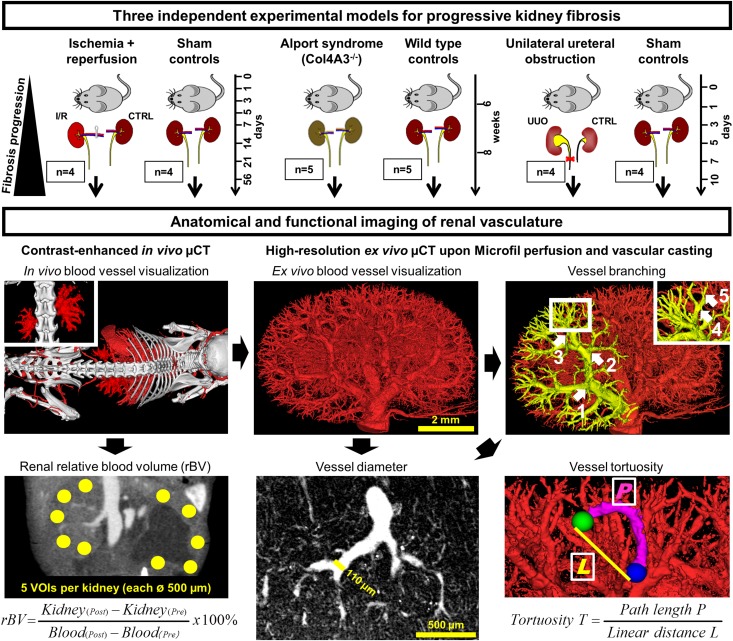
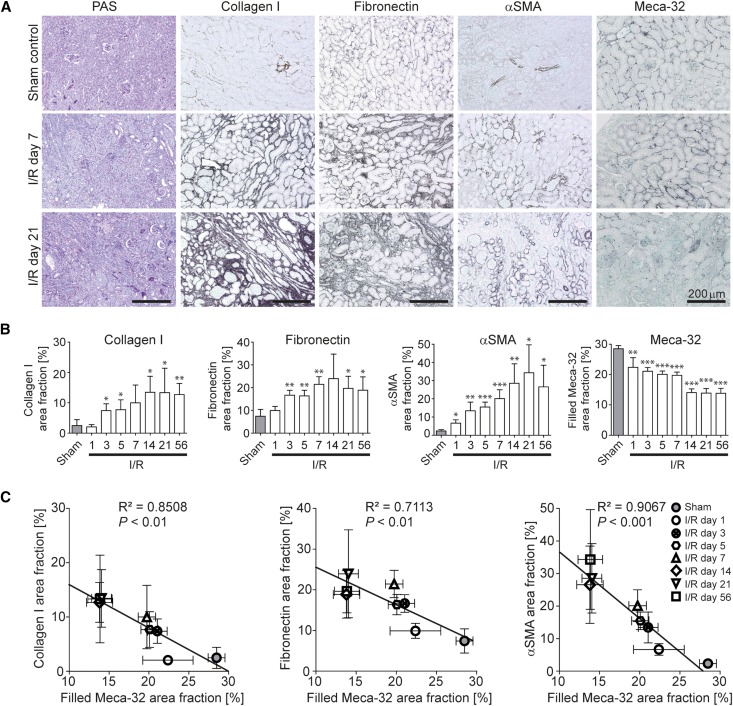
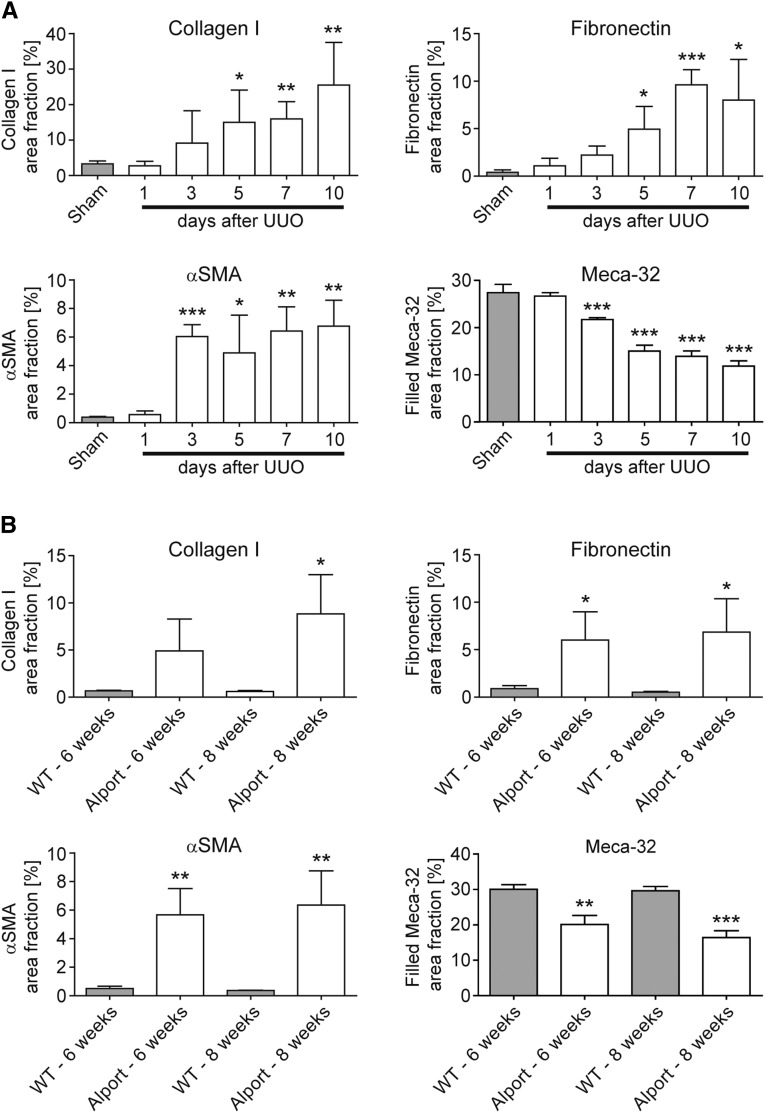
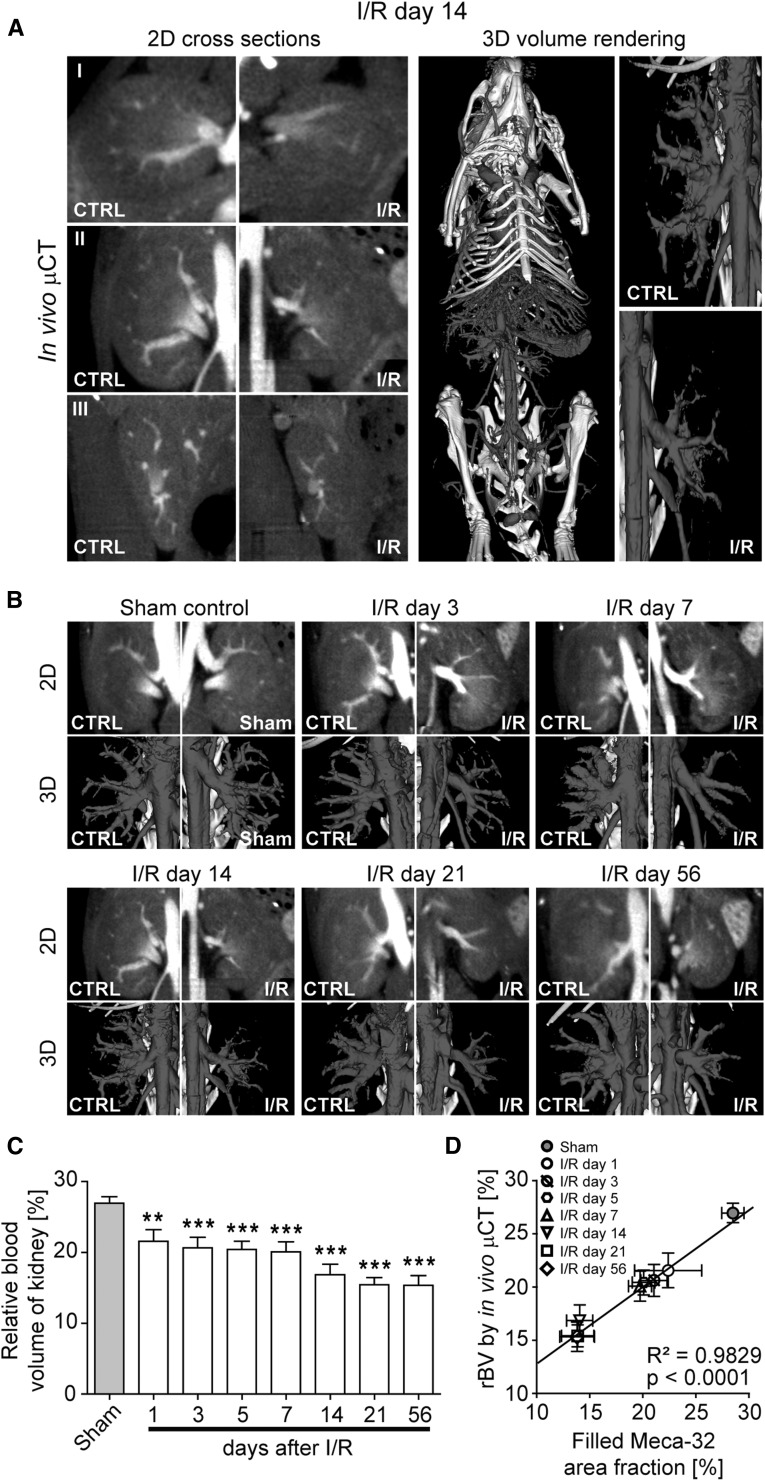
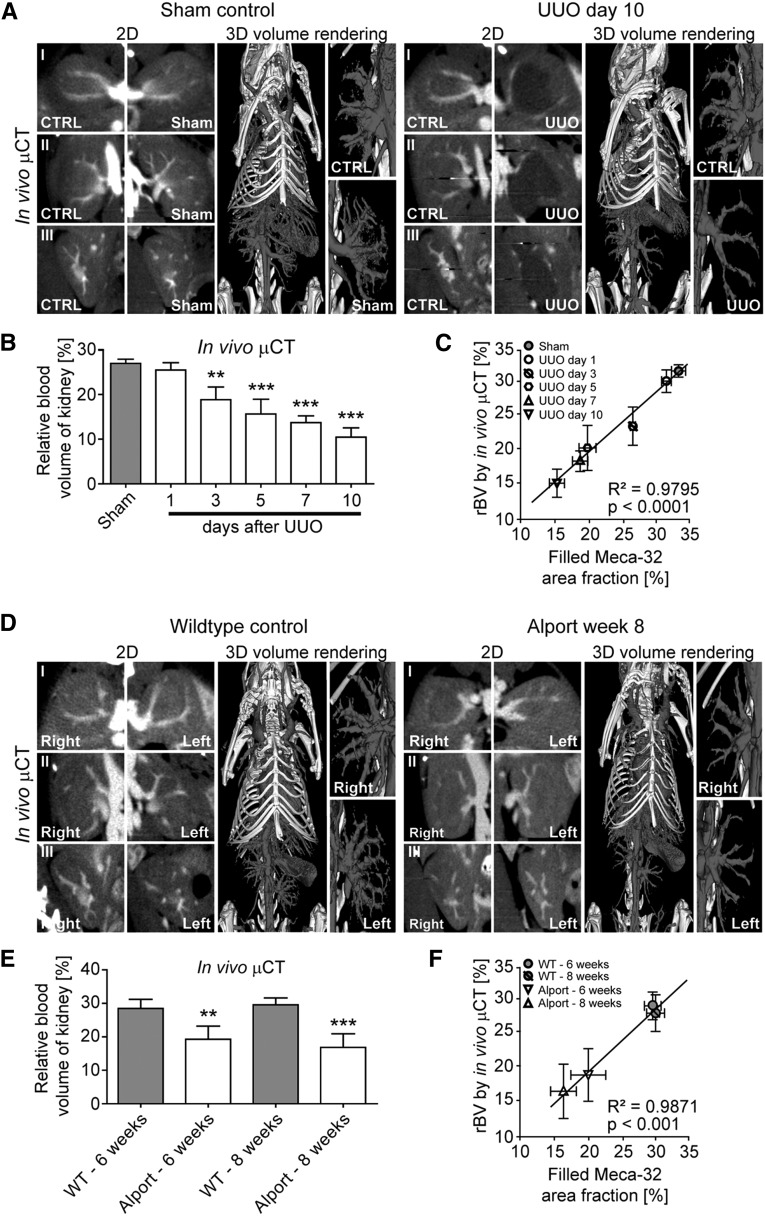
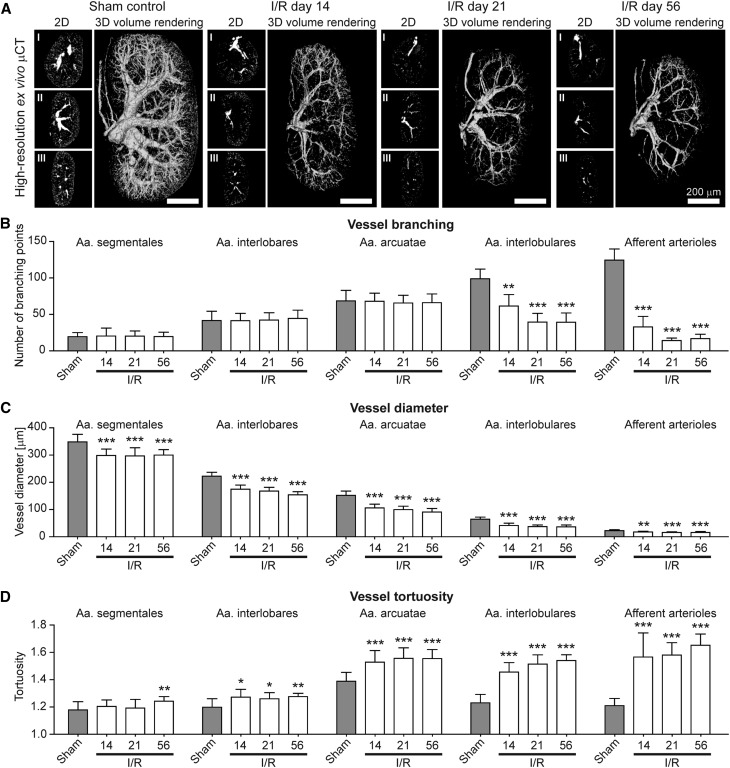
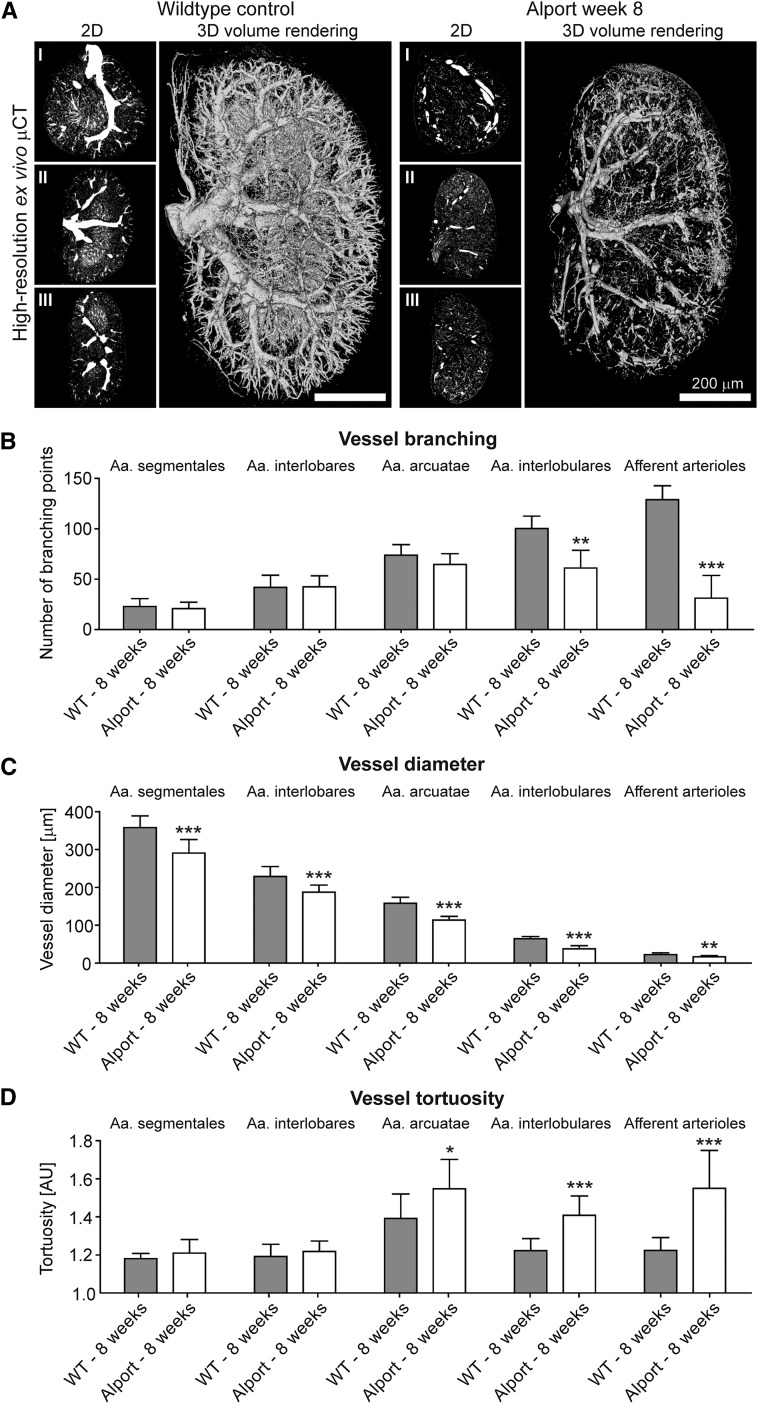
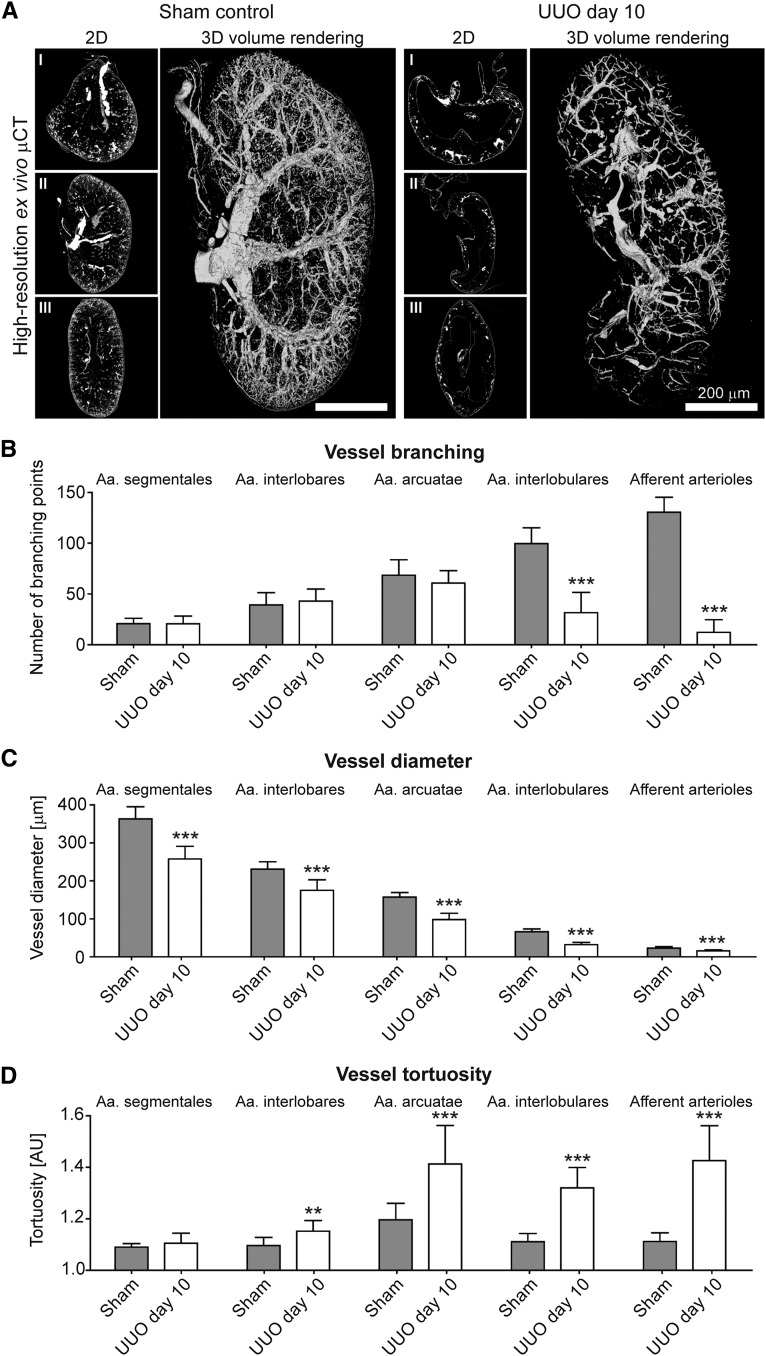
Progressive kidney diseases and renal fibrosis are associated with endothelial injury and capillary rarefaction. However, our understanding of these processes has been hampered by the lack of tools enabling the quantitative and noninvasive monitoring of vessel functionality. Here, we used micro-computed tomography (µCT) for anatomical and functional imaging of vascular alterations in three murine models with distinct mechanisms of progressive kidney injury: ischemia-reperfusion (I/R, days 1-56), unilateral ureteral obstruction (UUO, days 1-10), and Alport mice (6-8 weeks old). Contrast-enhanced in vivo µCT enabled robust, noninvasive, and longitudinal monitoring of vessel functionality and revealed a progressive decline of the renal relative blood volume in all models. This reduction ranged from -20% in early disease stages to -61% in late disease stages and preceded fibrosis. Upon Microfil perfusion, high-resolution ex vivo µCT allowed quantitative analyses of three-dimensional vascular networks in all three models. These analyses revealed significant and previously unrecognized alterations of preglomerular arteries: a reduction in vessel diameter, a prominent reduction in vessel branching, and increased vessel tortuosity. In summary, using µCT methodology, we revealed insights into macro-to-microvascular alterations in progressive renal disease and provide a platform that may serve as the basis to evaluate vascular therapeutics in renal disease.
Keywords: capillary rarefaction; chronic kidney disease; computed tomography; fibrosis; imaging; noninvasive.
Copyright © 2016 by the American Society of Nephrology.
Figures
Similar articles
-
3D autofluorescence imaging of hydronephrosis and renal anatomical structure using cryo-micro-optical sectioning tomography.Theranostics. 2023 Sep 4;13(14):4885-4904. doi: 10.7150/thno.86695. eCollection 2023. Theranostics. 2023. PMID: 37771780 Free PMC article.
-
CCL2-dependent infiltrating macrophages promote angiogenesis in progressive liver fibrosis.Gut. 2014 Dec;63(12):1960-1971. doi: 10.1136/gutjnl-2013-306294. Epub 2014 Feb 21. Gut. 2014. PMID: 24561613 Free PMC article.
-
Contrast-enhanced CT imaging in patients with chronic kidney disease.Angiogenesis. 2016 Oct;19(4):525-35. doi: 10.1007/s10456-016-9524-7. Epub 2016 Aug 31. Angiogenesis. 2016. PMID: 27582011
-
Imaging the Renal Microcirculation in Cell Therapy.Cells. 2021 May 2;10(5):1087. doi: 10.3390/cells10051087. Cells. 2021. PMID: 34063200 Free PMC article. Review.
-
Review--3D micro CT imaging of renal micro-structural changes.Nephron Clin Pract. 2006;103(2):c66-70. doi: 10.1159/000090611. Epub 2006 Mar 10. Nephron Clin Pract. 2006. PMID: 16543758 Review.
Cited by
-
Microvascular disease in chronic kidney disease: the base of the iceberg in cardiovascular comorbidity.Clin Sci (Lond). 2020 Jun 26;134(12):1333-1356. doi: 10.1042/CS20200279. Clin Sci (Lond). 2020. PMID: 32542397 Free PMC article. Review.
-
Endothelial Dysfunction in Renal Interstitial Fibrosis.Nephron. 2016;134(3):167-171. doi: 10.1159/000447607. Epub 2016 Aug 30. Nephron. 2016. PMID: 27576317 Free PMC article. Review.
-
Endothelial dysfunction: molecular mechanisms and clinical implications.MedComm (2020). 2024 Jul 22;5(8):e651. doi: 10.1002/mco2.651. eCollection 2024 Aug. MedComm (2020). 2024. PMID: 39040847 Free PMC article. Review.
-
Microvascular remodeling and altered angiogenic signaling in human kidneys distal to occlusive atherosclerotic renal artery stenosis.Nephrol Dial Transplant. 2022 Sep 22;37(10):1844-1856. doi: 10.1093/ndt/gfac156. Nephrol Dial Transplant. 2022. PMID: 35451482 Free PMC article.
-
LncRNA TUG1 regulates the development of ischemia-reperfusion mediated acute kidney injury through miR-494-3p/E-cadherin axis.J Inflamm (Lond). 2021 Mar 4;18(1):12. doi: 10.1186/s12950-021-00278-4. J Inflamm (Lond). 2021. PMID: 33663500 Free PMC article.
References
-
- Bohle A, Kressel G, Müller CA, Müller GA: The pathogenesis of chronic renal failure. Pathol Res Pract 185: 421–440, 1989 - PubMed
-
- Basile DP, Donohoe D, Roethe K, Osborn JL: Renal ischemic injury results in permanent damage to peritubular capillaries and influences long-term function. Am J Physiol Renal Physiol 281: F887–F899, 2001 - PubMed
-
- Matsumoto M, Tanaka T, Yamamoto T, Noiri E, Miyata T, Inagi R, Fujita T, Nangaku M: Hypoperfusion of peritubular capillaries induces chronic hypoxia before progression of tubulointerstitial injury in a progressive model of rat glomerulonephritis. J Am Soc Nephrol 15: 1574–1581, 2004 - PubMed
-
- Eardley KS, Kubal C, Zehnder D, Quinkler M, Lepenies J, Savage CO, Howie AJ, Kaur K, Cooper MS, Adu D, Cockwell P: The role of capillary density, macrophage infiltration and interstitial scarring in the pathogenesis of human chronic kidney disease. Kidney Int 74: 495–504, 2008 - PubMed
-
- Boor P, Ostendorf T, Floege J: Renal fibrosis: novel insights into mechanisms and therapeutic targets. Nat Rev Nephrol 6: 643–656, 2010 - PubMed
Publication types
MeSH terms
Grants and funding
LinkOut - more resources
Full Text Sources
Other Literature Sources
Medical
