. 2015 Aug 4;112(31):9751-6.
doi: 10.1073/pnas.1511810112. Epub 2015 Jul 20.

Huntington's disease: Neural dysfunction linked to inositol polyphosphate multikinase

Affiliations

Huntington's disease: Neural dysfunction linked to inositol polyphosphate multikinase

Ishrat Ahmed et al. Proc Natl Acad Sci U S A. .

Abstract

Huntington's disease (HD) is a progressive neurodegenerative disease caused by a glutamine repeat expansion in mutant huntingtin (mHtt). Despite the known genetic cause of HD, the pathophysiology of this disease remains to be elucidated. Inositol polyphosphate multikinase (IPMK) is an enzyme that displays soluble inositol phosphate kinase activity, lipid kinase activity, and various noncatalytic interactions. We report a severe loss of IPMK in the striatum of HD patients and in several cellular and animal models of the disease. This depletion reflects mHtt-induced impairment of COUP-TF-interacting protein 2 (Ctip2), a striatal-enriched transcription factor for IPMK, as well as alterations in IPMK protein stability. IPMK overexpression reverses the metabolic activity deficit in a cell model of HD. IPMK depletion appears to mediate neural dysfunction, because intrastriatal delivery of IPMK abates the progression of motor abnormalities and rescues striatal pathology in transgenic murine models of HD.

Keywords: Akt; Ctip2; Huntington's disease; IPMK; inositol polyphosphate multikinase.


Conflict of interest statement

The authors declare no conflict of interest.

Figures
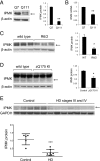
Fig. 1.
Fig. 1.
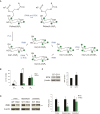
IPMK protein and mRNA levels are decreased in HD. (A) IPMK protein levels are decreased in Q111 cells. Bars represent means ± SEM normalized to β-actin (n = 3). **P < 0.01 relative to Q7 cells. (B) IPMK mRNA levels are also reduced in Q111 cells. Bars represent means ± SEM normalized to β-actin mRNA (n = 3). **P < 0.01 relative to Q7 cells. (C) R6/2 striatal samples contain less IPMK than littermate controls. (D) IPMK levels also are decreased in zQ175 striatum. In C and D, bars represent means ± SEM normalized to β-actin (n = 3). *P < 0.05 relative to wild type. (E) IPMK protein is decreased in postmortem HD striatum. Bars represent means ± SEM normalized to GAPDH (n = 5 for control group and n = 7 for HD group). ***P < 0.001 relative to control.
Fig. S1.
Fig. S1.
Catalytic activities of IPMK. (A) Both IPMK and the p110 PI3-kinase (PI3K) phosphorylate PtdIns(4,5)P2 (PIP2) to produce PtdIns(3,4,5)P3 (PIP3). PtdIns(4,5)P2 also can be cleaved by phospholipase C (PLC), thereby generating Ins(1,4,5)P3 (IP3). IPMK additionally phosphorylates IP3 to produce inositol-1,4,5,6-tetrakisphosphate [Ins(1,4,5,6)P4] and inositol-1,3,4,5-tetrakisphosphate [Ins(1,3,4,5)P4], both known as IP4. Ins(1,3,4,5)P4 also results from the catalytic activity of Ins(1,4,5)P3-kinase (IP3K). IPMK phosphorylates IP4 to produce inositol-1,3,4,5,6-pentakisphosphate (IP5), [Ins(1,3,4,5,6)P5], which is subsequently phosphorylated by inositol 1,3,4,5,6-pentakisphosphate 2-kinase (IPPK or IPK1) to produce Ins(1,2,3,4,5,6)P6. The higher inositol phosphates, containing pyrophosphate moieties, are not shown. Circles indicate phosphate groups. (B) IP4 and IP5 levels are depleted in Q111 cells, but IP6 levels remain normal. Bars represent mean disintegrations/min (D.P.M.) ± SEM normalized to myo-inositol levels (n = 6). *P < 0.05, **P < 0.01 relative to Q7 controls. (C) IPPK levels are elevated in Q111 cells. Bars represent means ± SEM normalized to β-actin (n = 3). *P < 0.05 relative to Q7 control. (D) IPMK protein levels are depleted in the cortex and hippocampus of R6/2 mice but not in the cerebellum. Bars represent means ± SEM normalized to β-actin (n = 4). *P < 0.05 relative to wild-type control.
Fig. 2.
Fig. 2.
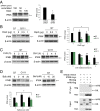
Transcriptional regulation and protein stability of IPMK are altered in Q111 striatal cells. (A) Ctip2 knockdown resulted in decreased IPMK expression. Bars represent means ± SEM normalized to β-actin (n = 3). *P < 0.05 relative to scrambled siRNA control. (B) Overexpression of Ctip2 in Q7 and Q111 cells rescues IPMK protein levels. Ctip2 also increases the expression of the unknown upper band. Bars represent means ± SEM normalized to β-actin (n = 3). *P < 0.05 relative to Q111 empty vector control. (C) IPMK protein levels in Q7 and Q111 cells following treatment with the translational inhibitor cycloheximide (CHX). Bars represent means ± SEM normalized to β-actin (n = 4). For Q7 cells, **P < 0.01 and *P < 0.05 relative to the Q7 0-h CHX treatment control. For Q111 cells, **P < 0.01 and ****P < 0.0001 relative to the Q111 0-h CHX control. (D) Bafilomycin (Baf), an inhibitor of lysosomal degradation, restores IPMK protein levels in the Q111 cells without altering IPMK protein levels in the Q7 cells. Bars represent means ± SEM normalized to β-actin (n = 3). *P < 0.05 relative to Q111 empty vector control. (E) Coimmunoprecipitation assay of HEK293 cells transfected with plasmids expressing myc-tagged human IPMK and the N-terminal fragment of either wild-type Htt (Htt-flag) or mHtt (mHtt-flag). IPMK binds selectively to the N-terminal fragment of mHtt but not to wild-type Htt.
Fig. S2.
Fig. S2.
Ctip2 protein is depleted in HD. (A) Ctip2 protein levels are reduced in the R6/2 striatum relative to wild-type mice. Bars represent means ± SEM normalized to β-actin (n = 3). *P < 0.05 relative to wild type. (B) Ctip2 protein levels are also reduced in the cortex and hippocampus of R6/2 mice. Ctip2 is not expressed in the cerebellum. Bars represent means ± SEM normalized to β-actin (n = 3). *P < 0.05, **P < 0.01 relative to wild-type control. (C) Treatment of Q7 and Q111 cells with the proteasomal inhibitor MG132 did not alter IPMK protein expression. Bars represent means ± SEM normalized to β-actin (n = 3). *P < 0.05, **P < 0.01 relative to Q7 control.
Fig. 3.
Fig. 3.
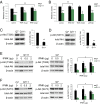
The lipid kinase activity of IPMK rescues the mitochondrial metabolic activity deficit in Q111 striatal cells and restores Akt signaling. (A) IPMK overexpression rescues the mitochondrial metabolic activity deficit in Q111 cells as measured by the MTT assay. (B) Overexpression of the kinase-dead mutant of IPMK (IPMK-KASA) or atIPK2β does not rescue the metabolic activity deficit measured by the MTT assay. In A and B, bars represent means ± SEM (n = 4). *P < 0.05, **P < 0.01, ****P < 0.0001 relative to the Q7 empty vector control unless otherwise indicated. (C) Akt phosphorylation at the T308 site [p-Akt (T308)] is decreased in Q111 cells. (D) Akt phosphorylation at the S473 site [p-Akt (S473)] also is reduced in Q111 cells. In C and D, bars represent means ± SEM normalized to total Akt (n = 3). **P < 0.01 relative to the Q7 control. (E) IPMK overexpression rescues the loss of p-Akt (T308) in Q111 cells but not in Q7 cells. (F) IPMK overexpression similarly rescues the loss of p-Akt (S473) in Q111 cells. In E and F, bars represent means ± SEM normalized to total Akt (n = 4). *P < 0.05 relative to the Q111 empty vector control sample.
Fig. 4.
Fig. 4.
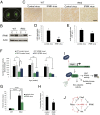
Virus-mediated expression of IPMK delays motor impairment of R6/2 mice. (A) Coronal section of mouse brain demonstrating intrastriatal virus expression 2 wk postinjection. (B) Striatal tissue obtained from R6/2 mice 10 wk postinjection with either GFP control AAV2 (denoted “C”) or IPMK-expressing AAV2 (denoted “I”) confirms increased IPMK expression (arrow) in wild-type and R6/2 animals receiving IPMK-expressing AAV2. The expression of the unknown upper band is also increased in tissues obtained from animals receiving the IPMK virus. (C) EM48-positive mHtt aggregates are present in R6/2 striatum and are absent in wild-type striatum. Virus-mediated overexpression of IPMK reduces the number and the size of mHtt aggregates. (Scale bar, 50 µm.) (D) Quantitation of number of mHtt aggregates per 40× field of view measuring 0.1 mm2. Bars represent the mean number of aggregates ± SEM (n = 3 animals). **P < 0.01 relative to the number of R6/2 control aggregates. (E) Quantitation of the size of mHtt aggregates based on the cross-sectional area of aggregates. Bars represent the mean size of aggregates ± SEM (n = 3 animals). *P < 0.05 relative to the size of aggregates in R6/2 control sections. (F) IPMK overexpression delays impairment of central locomotor activity. Bars represent mean beam breaks ± SEM (n = 9–12 animals per group). *P < 0.05, **P < 0.01 relative to either wild-type or R6/2 mice injected with control virus. (G) IPMK restores motor coordination and balance assessed by balance beam performance. Bars represent the mean of the total time required to cross the beam ± SEM (n = 7–10 animals per group). **P < 0.01, ****P < 0.0001 relative to either wild-type or R6/2 mice injected with control virus. (H) General phenotype based on clasping, kyphosis, gait, and ledge walking is presented as a composite score and is improved by IPMK overexpression. Bars represent means ± SEM (n = 9–10 animals per group). *P < 0.05 relative to R6/2 mice receiving control virus. (I) In normal striatal cells, Ctip2 up-regulates IPMK expression. IPMK displays several functions, including the lipid kinase activity, which enhances Akt signaling, as well as a soluble inositol phosphate kinase activity and various noncatalytic activities. In HD, Ctip2 transcriptional activity and expression is inhibited by mHtt, resulting in decreased IPMK transcription. Decreased IPMK protein stability, likely caused by the selective interaction with mHtt, further reduces IPMK protein levels, resulting in the loss of Akt phosphorylation. (J) Our current model indicates that Ctip2 up-regulates IPMK, which in turn enhances Akt phosphorylation. Rhes also has been shown to increase Akt phosphorylation in healthy cells. Additional mechanisms in HD cells (indicated in red), include Akt-mediated phosphorylates and inhibition of mHtt. Furthermore, Ctip2 and IPMK are both impaired by mHtt. The roles of Rhes in modulating Ctip2 function in healthy and HD cells and the effect of Rhes on Akt in the presence of mHtt remain to be elucidated.
Fig. S3.
Fig. S3.
Survival and weight of wild-type and R6/2 mice injected with either control or IPMK-expressing virus. (A) Intrastriatal injections were performed at age 3 wk followed by behavior testing at 6, 8, and 10 wk of age. Pathology was assessed at 10 wk. (B) R6/2 mice injected with either control or IPMK virus show a similar and gradual decrease in weight over time. IPMK overexpression did not affect wild-type mice (n = 10 for wild type with control virus, n = 9 for wild type with IPMK virus, n = 17 for R6/2 with control virus, and n = 13 for R6/2 with IPMK virus). (C) The Kaplan–Meier curve indicates that striatal overexpression of IPMK did not alter survival in wild-type or R6/2 mice (n = 10 for wild type with control virus, n = 11 for wild type with IPMK virus, n = 11 for R6/2 with control virus, n = 11 for R6/2 with IPMK virus).
Fig. S4.
Fig. S4.
Effect of virus-mediated expression of IPMK on additional motor performance. (A) IPMK overexpression does not affect rotarod performance at 6, 8, and 10 wk of age. Bars represent the mean time to fall in seconds ± SEM (n = 7–11 animals per group). *P < 0.05, **P < 0.01, ***P < 0.001 relative to wild-type mice injected with either control or IPMK virus. (B) IPMK overexpression improves R6/2 animal gait, specifically stride length at 10 wk of age. (Upper) Forepaw and hindpaw prints are shown in red and blue, respectively. (Lower) Bars represent mean stride length in centimeters ± SEM (n = 6–10 animals per group). *P < 0.05, **P < 0.01, ****P < 0.0001 relative to wild-type mice or R6/2 mice injected with control virus as indicated.

Similar articles

Cited by

References

    1. The Huntington’s Disease Collaborative Research Group A novel gene containing a trinucleotide repeat that is expanded and unstable on Huntington’s disease chromosomes. Cell. 1993;72(6):971–983. - PubMed
    1. Reiner A, et al. Differential loss of striatal projection neurons in Huntington disease. Proc Natl Acad Sci USA. 1988;85(15):5733–5737. - PMC - PubMed
    1. Beal MF, et al. Replication of the neurochemical characteristics of Huntington’s disease by quinolinic acid. Nature. 1986;321(6066):168–171. - PubMed
    1. Zuccato C, et al. Loss of huntingtin-mediated BDNF gene transcription in Huntington’s disease. Science. 2001;293(5529):493–498. - PubMed
    1. Sugars KL, Rubinsztein DC. Transcriptional abnormalities in Huntington disease. Trends Genet. 2003;19(5):233–238. - PubMed

Publication types

MeSH terms

Substances

LinkOut - more resources