

Assessing incremental value of biomarkers with multi-phase nested case-control studies
- PMID: 26195245
- PMCID: PMC4819437
- DOI: 10.1111/biom.12344
Assessing incremental value of biomarkers with multi-phase nested case-control studies
Abstract
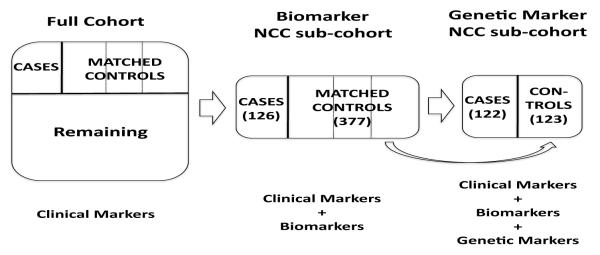
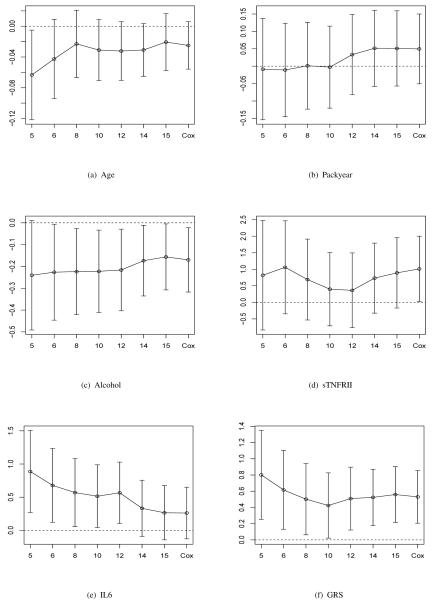
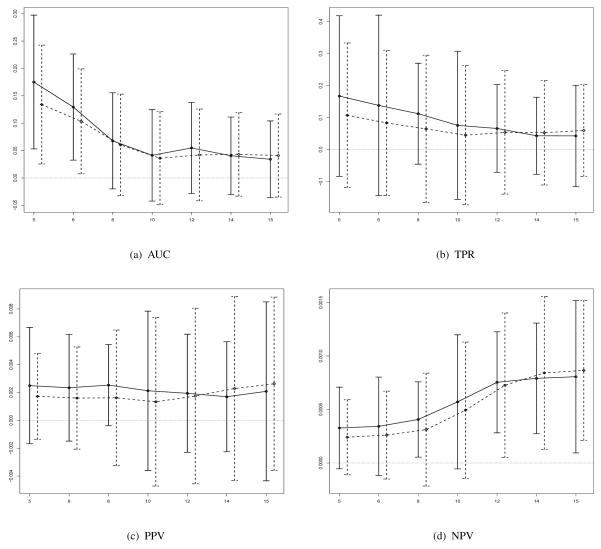
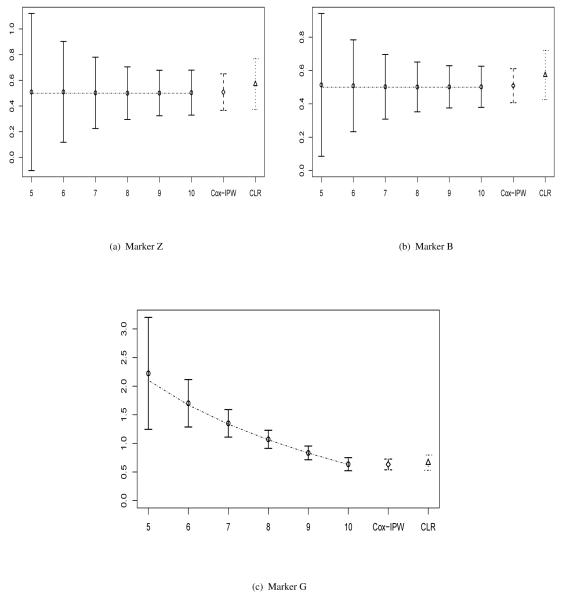
Accurate risk prediction models are needed to identify different risk groups for individualized prevention and treatment strategies. In the Nurses' Health Study, to examine the effects of several biomarkers and genetic markers on the risk of rheumatoid arthritis (RA), a three-phase nested case-control (NCC) design was conducted, in which two sequential NCC subcohorts were formed with one nested within the other, and one set of new markers measured on each of the subcohorts. One objective of the study is to evaluate clinical values of novel biomarkers in improving upon existing risk models because of potential cost associated with assaying biomarkers. In this paper, we develop robust statistical procedures for constructing risk prediction models for RA and estimating the incremental value (IncV) of new markers based on three-phase NCC studies. Our method also takes into account possible time-varying effects of biomarkers in risk modeling, which allows us to more robustly assess the biomarker utility and address the question of whether a marker is better suited for short-term or long-term risk prediction. The proposed procedures are shown to perform well in finite samples via simulation studies.
Keywords: Incremental value; Inverse probability weighting; Nested case-control study; Rheumatoid arthritis; Risk prediction; Time dependent ROC curve analysis.
© 2015, The International Biometric Society.
Figures
Similar articles
-
Assessment of biomarkers for risk prediction with nested case-control studies.Clin Trials. 2013 Oct;10(5):677-9. doi: 10.1177/1740774513498321. Epub 2013 Sep 6. Clin Trials. 2013. PMID: 24013405 Free PMC article.
-
Evaluating longitudinal markers under two-phase study designs.Biostatistics. 2019 Jul 1;20(3):485-498. doi: 10.1093/biostatistics/kxy013. Biostatistics. 2019. PMID: 29912281 Free PMC article.
-
Biomarker evaluation under imperfect nested case-control design.Stat Med. 2021 Aug 15;40(18):4035-4052. doi: 10.1002/sim.9012. Epub 2021 Apr 29. Stat Med. 2021. PMID: 33915597 Free PMC article.
-
Reliable and cost-effective serodiagnosis of rheumatoid arthritis.Rheumatol Int. 2016 Jun;36(6):751-8. doi: 10.1007/s00296-016-3433-3. Epub 2016 Feb 9. Rheumatol Int. 2016. PMID: 26856871 Review.
-
Defining the proteomic landscape of rheumatoid arthritis: progress and prospective clinical applications.Expert Rev Proteomics. 2017 May;14(5):431-444. doi: 10.1080/14789450.2017.1321481. Epub 2017 May 2. Expert Rev Proteomics. 2017. PMID: 28425787 Review.
Cited by
-
Canadian brain cancer survival rates by tumour type and region: 1992-2008.Can J Public Health. 2016 Jun 27;107(1):e37-e42. doi: 10.17269/cjph.107.5209. Can J Public Health. 2016. PMID: 27348108 Free PMC article.
-
Nonparametric Maximum Likelihood Estimators of Time-Dependent Accuracy Measures for Survival Outcome Under Two-Stage Sampling Designs.J Am Stat Assoc. 2018;113(522):882-892. doi: 10.1080/01621459.2017.1295866. Epub 2017 Feb 28. J Am Stat Assoc. 2018. PMID: 30555194 Free PMC article.
-
New weighting methods when cases are only a subset of events in a nested case-control study.Biom J. 2022 Oct;64(7):1240-1259. doi: 10.1002/bimj.202100194. Epub 2022 Jun 26. Biom J. 2022. PMID: 35754309 Free PMC article.
References
-
- Boekholdt SM, Hack CE, Sandhu MS, Luben R, Bingham SA, Wareham NJ, Peters RJ, Jukema JW, Day NE, Kastelein JJ, Khaw K-T. C-reactive protein levels and coronary artery disease incidence and mortality in apparently healthy men and women: the epic-norfolk prospective population study 1993-2003. Atherosclerosis. 2006;187:415–422. - PubMed
Publication types
MeSH terms
Substances
Grants and funding
LinkOut - more resources
Full Text Sources
Other Literature Sources
