. 2015 Nov:485:1-15.
doi: 10.1016/j.virol.2015.06.021. Epub 2015 Jul 14.

Therapeutic doses of irradiation activate viral transcription and induce apoptosis in HIV-1 infected cells

Affiliations

Therapeutic doses of irradiation activate viral transcription and induce apoptosis in HIV-1 infected cells

Sergey Iordanskiy et al. Virology. 2015 Nov.

Abstract

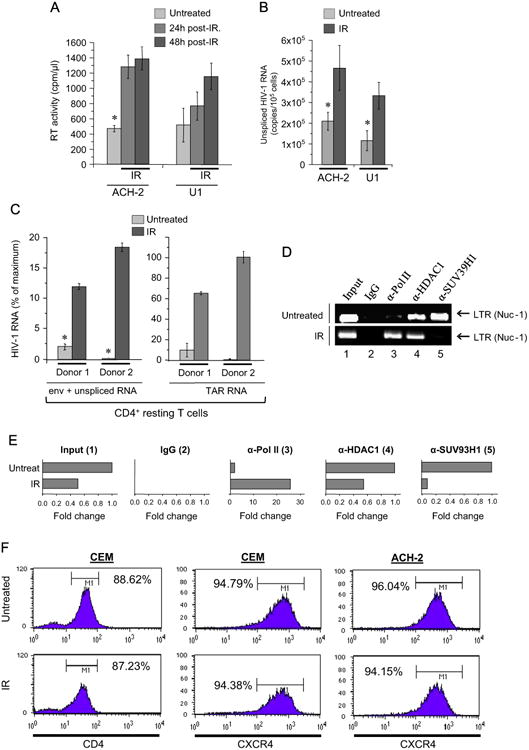
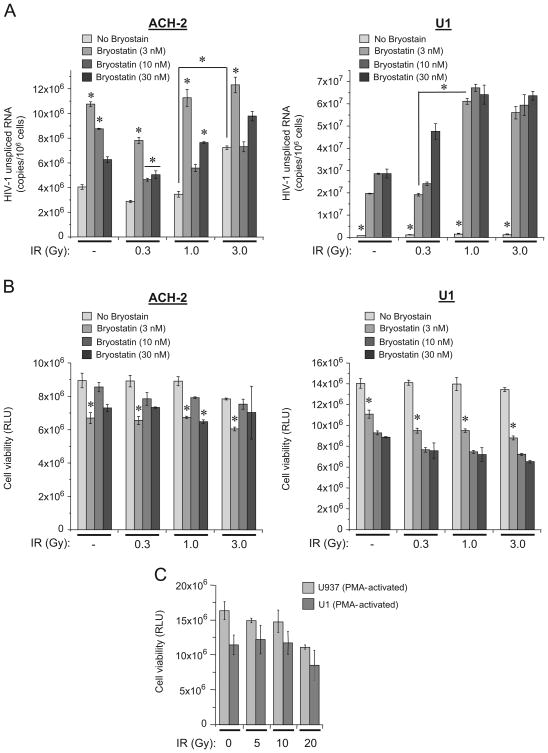
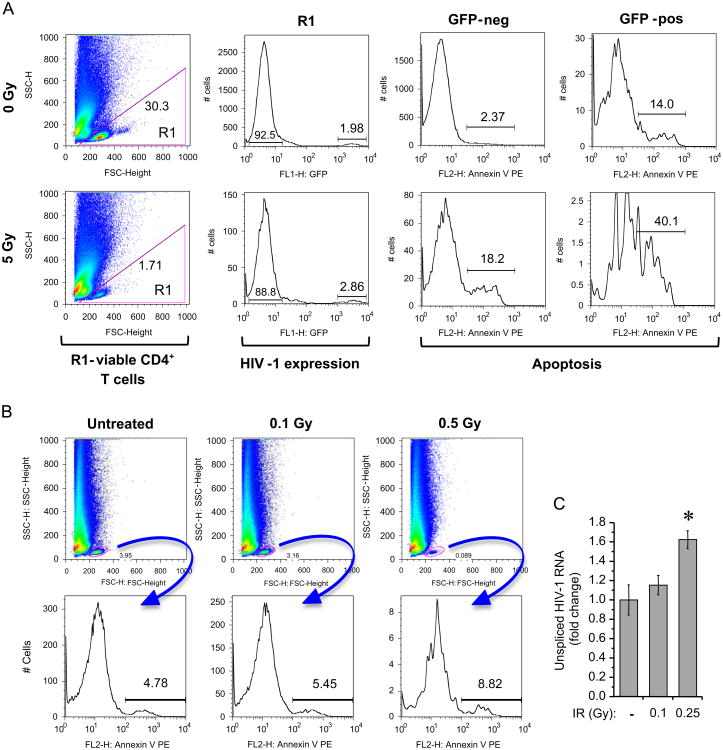
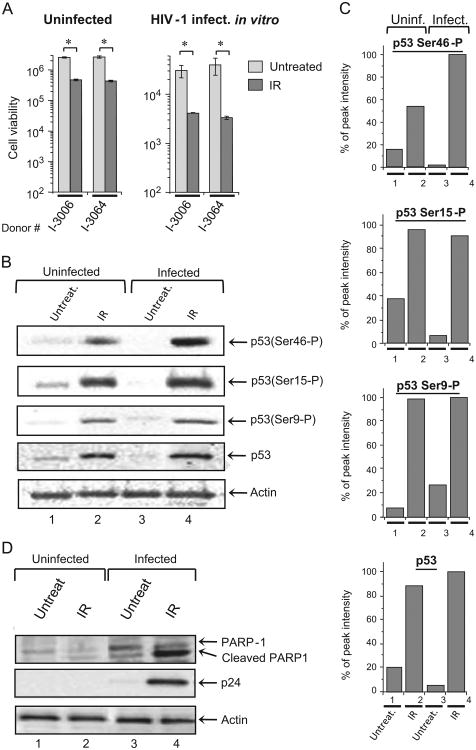
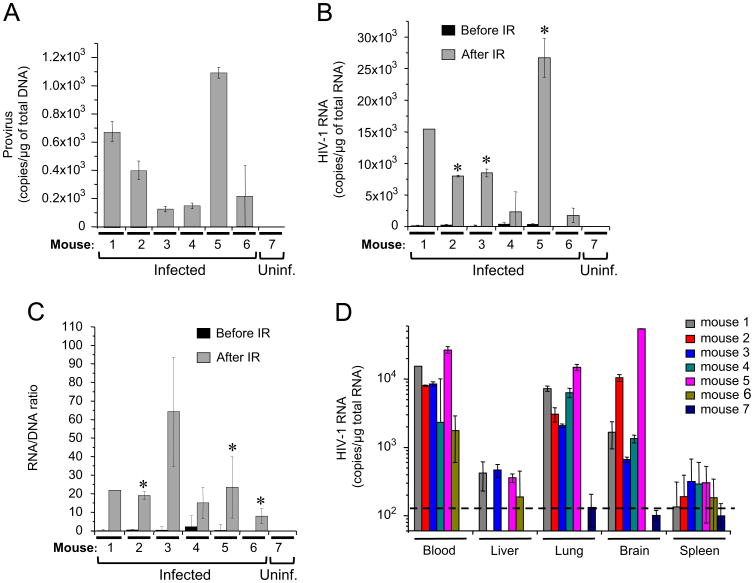
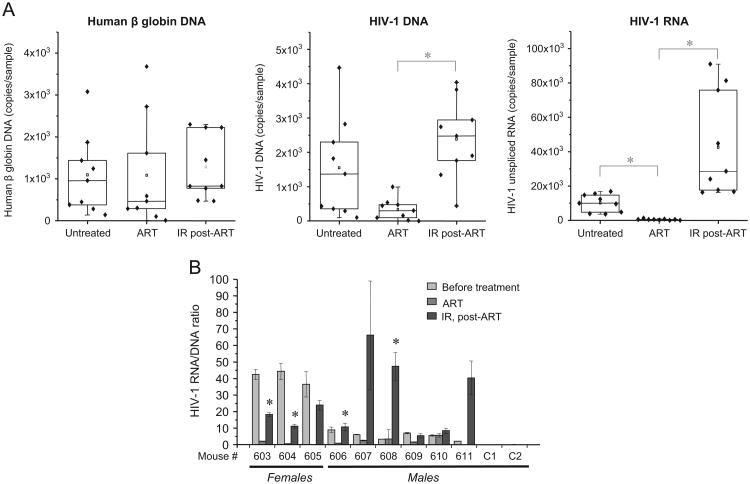
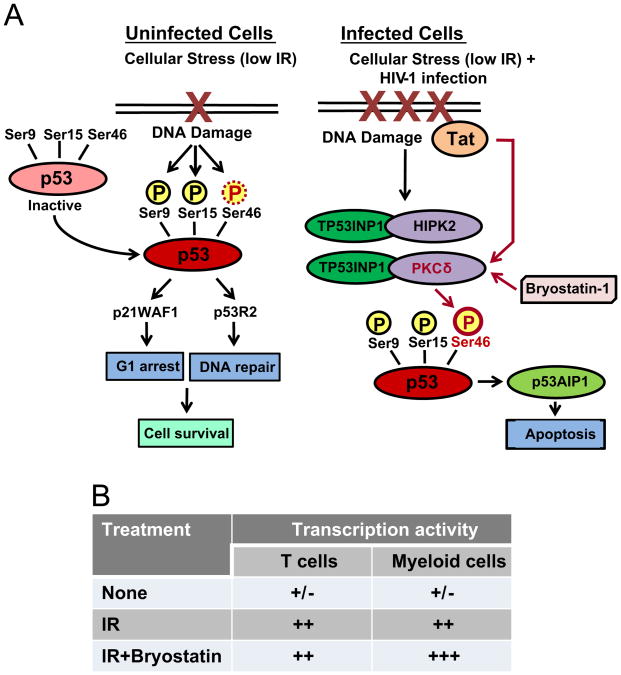
The highly active antiretroviral therapy reduces HIV-1 RNA in plasma to undetectable levels. However, the virus continues to persist in the long-lived resting CD4(+) T cells, macrophages and astrocytes which form a viral reservoir in infected individuals. Reactivation of viral transcription is critical since the host immune response in combination with antiretroviral therapy may eradicate the virus. Using the chronically HIV-1 infected T lymphoblastoid and monocytic cell lines, primary quiescent CD4(+) T cells and humanized mice infected with dual-tropic HIV-1 89.6, we examined the effect of various X-ray irradiation (IR) doses (used for HIV-related lymphoma treatment and lower doses) on HIV-1 transcription and viability of infected cells. Treatment of both T cells and monocytes with IR, a well-defined stress signal, led to increase of HIV-1 transcription, as evidenced by the presence of RNA polymerase II and reduction of HDAC1 and methyl transferase SUV39H1 on the HIV-1 promoter. This correlated with the increased GFP signal and elevated level of intracellular HIV-1 RNA in the IR-treated quiescent CD4(+) T cells infected with GFP-encoding HIV-1. Exposition of latently HIV-1infected monocytes treated with PKC agonist bryostatin 1 to IR enhanced transcription activation effect of this latency-reversing agent. Increased HIV-1 replication after IR correlated with higher cell death: the level of phosphorylated Ser46 in p53, responsible for apoptosis induction, was markedly higher in the HIV-1 infected cells following IR treatment. Exposure of HIV-1 infected humanized mice with undetectable viral RNA level to IR resulted in a significant increase of HIV-1 RNA in plasma, lung and brain tissues. Collectively, these data point to the use of low to moderate dose of IR alone or in combination with HIV-1 transcription activators as a potential application for the "Shock and Kill" strategy for latently HIV-1 infected cells.

Keywords: Apoptosis; CD4+ T cells; HIV-1 latency; HIV-1 reactivation; Humanized mice; Irradiation; Monocytes; Transcription; X-ray.


Figures

Fig. 1
Fig. 1. IR activates viral transcription in chronically HIV-1 infected cell lines and primary CD4+ T cells through the enhancement of LTR-driven transcription
(A) Chronically HIV-1 infected T cell line ACH-2 and promonocytes U1 were exposed to 5 Gy X-ray irradiation (IR). Reverse transcriptase (RT) activity was measured in culture medium at indicated time points. Results are shown as a mean of three independent measurements ± SD. Asterisk indicates p ≤0.05. (B) Same cell lines were pretreated with ART cocktail (indinavir, tenofovir, lamivudine/emitricitabine, 10 μM of each) for 10 days, washed and then exposed to 5 Gy X-ray IR in a fresh culture medium. HIV-1 RNA was measured in the cytoplasmic extracts at 24 h post-IR by quantitative RT-PCR using gag-specific primers. Results are shown as a mean of three independent measurements ± SD. Asterisk indicates p ≤ 0.01. (C) PBMCs isolated from two healthy donors were infected with HIV-1 89.6 dual-tropic strain (10 ng p24/105 primary activated PBMCs), and then cultured for 45 days with IL-7 (added every 5 days) to place cells into the resting phase. Then the cells were exposed to 5 Gy dose of IR. HIV-1 RNA was measured in the cytoplasmic extracts at 72 h post-IR by quantitative RT-PCR using env-specific and TAR-specific primers. The RNA count is shown as a percentage of maximal level of TAR RNA in the cell lysate. The results are shown as a mean of triplicate measurements ± SD. Asterisk indicates p ≤ 0.01. (D) Chromatin immunoprecipitation (ChIP) assay of the nuclear extracts from ACH-2 cells was performed with indicated antibodies at 24 h post-IR as described in Materials and Methods. Specific DNA sequences in the immunoprecipitates were detected by PCR using primers specific for the HIV-1 LTR. E) The data of ChIP assay (panel D) were quantified using ImageJ software. Results are presented as a fold change of grey values for the LTR DNA bands in each immunocomplex; the value of untreated control is shown as 1. (F) IR does not affect surface presentation of CD4 and CXCR4 receptors in HIV-1 infected and uninfected cells. The uninfected (CEM) and chronically HIV-1 infected (ACH-2) T cells were exposed to 5 Gy IR, and then analyzed by flow cytometry with FITC-anti-human CD4 and PE-anti-human CXCR4 labeling performed 24 h post IR treatment.
Fig. 2
Fig. 2. IR enhances bryostatin 1-induced activation of HIV-1 transcription in latently infected monocytes
(A) Effect of IR on ACH-2 (left panel) and U1 (right panel) cells treated with bryostatin 1. The cells were cultured with ART cocktail for 10 days as described in Fig. 1B and then treated with 3 nM, 10 nM or 30 nM bryostatin-1 in PBS. At 4 h post-treatment the cells were exposed to indicated doses of IR. Quantitative RT-PCR analysis of unspliced HIV-1 RNA with gag-specific primers was performed 44 h after IR. Results are shown as a mean of three independent measurements ± SD. Asterisks indicate p ≤ 0.01 between indicated samples and untreated (No bryostatin) control or between the samples connected by bracket. (B) Viability of ACH-2 (left panel) and U1 (right panel) cells treated with bryostatin 1 and exposed to IR. The cells were treated as described in (A), harvested 44 h after IR and subjected to CellTiter Glo assay (Promega). Results are shown as a mean of three independent experiments ± SD. Asterisks indicate p ≤ 0.01 between indicated samples and untreated (No bryostatin) control. (C) The parental uninfected U937 and chronically HIV-1 infected U1 promonocytic cells were stimulated with 10 nM PMA to differentiate into the macrophage phenotype. After 72 h incubation, the cells were exposed to X-ray IR. Cell viability was assessed 72 h post-treatment using CellTiter Glo assay (Promega). Results are shown as a mean of triplicate experiment ± SD.
Fig. 3
Fig. 3. IR activates HIV-1 replication and enhances apoptosis in latently infected primary quiescent CD4+ T cells
(A) Flow cytometry analysis of HIV-1 replication and apoptosis in activated (memory-phenotype) primary CD4+ T cells enriched by negative selection from CD4+ T cells and monocyte-derived dendritic cell cultures and infected with replication competent HIV-1 strain expressing GFP. The HIV-1 infected quiescent CD4+ T cells were treated with single 5 Gy X-ray IR dose, cultured for 96 h and then subjected to flow cytometry. Left panels show gating of live cells (R1) with numbers representing percent of total counts in plot (based on FSC-H vs. SSC-H). Other plots represent analysis of R1 sub-population. The HIV-1 replication was measured as a percent of GFP-positive cells within the R1 population (second column of panels); the percent of apoptotic cells was measured using Annexin V staining separately in subpopulations of GFP-negative and GFP-positive cells (right two columns of panels). (B) Flow cytometry analysis of apoptosis in IR-treated uninfected primary CD4+ T cells (memory-phenotype) prepared as described in panel A. The cells were exposed to indicated doses of IR and then analyzed at 48 h post-IR. The upper row indicates gating of living cells (R1) with numbers representing percent of total counts in plot (based on FSC-H vs SSC-H). The bottom row shows the percent of apoptotic cells measured using Annexin V staining in the gated R1 sub-population. (C) The count of unspliced HIV-1 RNA in the lysates of infected resting CD4+ T cells treated with indicated X-ray IR doses, measured by RT-qPCR with gag-specific primers 72 h after IR. Results are shown as a mean of three independent measurements ± SD. Asterisk indicates p ≤ 0.05 between indicated sample and unexposed (No IR) or 0.25 Gy IR exposed cells.
Fig. 4
Fig. 4. IR activates p53 in both uninfected and chronically HIV-1 infected T cells, but enhances apoptosis in the infected cells
(A) IR differentially induces apoptosis in HIV-1 infected and uninfected PBMCs: the cells from two donors were infected or not with 89.6 dual-tropic strain of HIV-1, cultured for 45 days with IL-7, irradiated with 5 Gy X-ray dose and then cultured for 48 h. Cell viability was measured using CellTiter Glo assay (Promega). Results are shown as a mean of three independent experiments ± SD. Asterisk indicates p ≤ 0.05 between indicated IR-exposed samples and non-irradiated cells. (B). Western blot analysis of p53 phosphorylation in the lysates of parental uninfected (CEM) and chronically HIV-1 infected T cells (ACH-2) in response to X-ray IR (5 Gy). The cells were harvested 48 h after exposure, lysed in cell lysis buffer containing proteasomal inhibitor cocktail (Roche). Lysates were then normalized according to the total protein concentration and subjected to SDS-PAGE and Western blot analysis with rabbit polyclonal antibodies against total p53 and indicated phosphorylated forms of p53 protein. (C) Quantitation of Western blot bands. Western blot bands were quantified using ImageJ software and results are presented as percentage of the peak value for each form of p53 protein (total or phosphorylated at Ser9, Ser15 or Ser46) in analyzed cell lysates. (D) Western blot of lysates of HIV-1 chronically-infected (ACH-2) and parental uninfected (CEM) T cell lines treated with X-ray IR (5 Gy). The cells were harvested at 48 h time point, lysed, normalized as described in panel B, and then subjected to SDS-PAGE and western blot analysis with rabbit polyclonal antibodies against PARP-1 and mouse monoclonal antibodies against HIV-1 p24 and actin.
Fig. 5
Fig. 5. IR activates HIV-1 transcription in various tissues of infected humanized mice
The NOD.Cg-Prkdcscid IL2rgtm1Wjl/SzJ (NSG) humanized mice were infected with dual-tropic HIV-1 89.6 strain as described in Materials and Methods. The latent animals (6 months after initial infection) were irradiated with 4 Gy non-lethal X-ray dose and sacrificed 10 days after IR. The blood, brain, liver, spleen and lung were harvested, homogenized and subjected to total RNA isolation. Pure RNA samples were analyzed by quantitative RT-real-time PCR with HIV-1 specific primers. (A) HIV-1 provirus counts in blood cells of infected animals, 10 days post-IR. The cellular fraction was isolated from 0.5 ml blood samples; total DNA was purified and subjected to real-time PCR with R-U5 LTR-specific primers to detect HIV-1 DNA. Results are shown as a mean of three independent measurements ± SD. (B) Viral RNA in the blood samples of animals – 28 days before and 10 days after IR. The total purified RNA was subjected to quantitative RT-PCR with gag-specific primers. Results are shown as a mean of three independent measurements ± SD. Asterisks indicate p ≤ 0.01 between RNA samples from the same animal before and after IR. (C) The HIV-1 RNA/DNA ratio in the blood of infected animals, 10 days post-IR. Total RNA and DNA were purified as in panels A and B, and then subjected to RT-qPCR with (RNA) or qPCR (DNA) with gag-specific primers. Results are shown as a mean of three independent measurements ± SD. Asterisks indicate p ≤ 0.01 between samples from the same animal before and after IR. (D) The total RNA extracted from indicated organs at day 10 after IR was subjected to HIV-1 RNA quantitation using qRT-PCR as described in (B). Results are shown as a mean of three independent measurements ± SD. The dash line indicates the cutoff level of HIV-1 RNA.
Fig. 6
Fig. 6. IR doses induce viral transcription in ART-treated latently HIV-1 infected humanized mice
Nine NSG humanized mice were infected with dual-tropic HIV-1 89.6 strain and two mice were left as an uninfected control. The infected and uninfected mice were injected i.p. three times with ART cocktail in week 8, 9 and 10 after infection time point. The mice were then irradiated with double 1 Gy doses of X-ray on days 7th and 9th after last ART injection. The 0.2 ml specimens of blood were collected before (Untreated), after ART treatment (ART) and 48 h after second IR (IR, post-ART). (A) Statistical analysis of HIV-1 response to ART treatment and IR in the blood samples from 9 infected animals. Total RNA and DNA was purified from the blood specimens and then subjected to RT-qPCR with oligo-dT and gag primers (RNA) to measure count of unspliced viral RNA, and to qPCR with human β globin and HIV-1 gag primers (DNA) to measure human and viral DNA count, respectively. Asterisk shows p value ≤ 0.05 between the samples connected by bracket. (B) The HIV-1 RNA/DNA ratio in the blood specimens of infected and control uninfected mice, 2 days post-second IR. Total RNA and DNA were purified and subjected to RT-qPCR and qPCR with HIV-1 gag-specific primers as described in panel A. Results are shown as a mean of three independent measurements ± SD. Asterisks indicate p ≤ 0.01 between RNA/DNA count in indicated samples (IR post-ART) and RNA/DNA count in the samples collected after ART from the same animal.
Fig. 7
Fig. 7. Summarized data of the effect of X-ray irradiation on the cell viability and virus transcription in HIV-1 infected cells
(A) IR-induced DNA damage in HIV-1 infected and uninfected cells mediates phosphorylation of various Ser residues on p53 protein resulting in DNA repair or apoptosis (adapted from Shahbazi et al. (2013) with modifications). Low IR doses cause DNA damage that activates p53 via phosphorylation of Ser9, Ser15 and Ser46 on p53 in uninfected cells as shown in Fig. 4B. Phosphorylated p53 activates p21WAF1 and p53-dependent ribonucleotide reductase p53R2 which induce G1 arrest and DNA repair pathway, respectively. IR of HIV-1 infected cells activates production of Tat and viral accessory proteins which cause up-regulation of DNA damage machinery (Kim et al., 2012; Koyama et al., 2013). Tat can also activate PKCδ (Bennasser and Bahraoui, 2002; Leghmari et al., 2008a, 2008b) that induces enhanced phosphorylation of Ser46 on p53 which results in p53-dependent apoptosis. (B) Consolidated data on the effect of IR and IR with latency-reversing agent bryostatin 1 on HIV-1 transcription in latently infected T cells and monocytes.

Similar articles

Cited by

References

    1. Agbottah E, Deng L, Dannenberg LO, Pumfery A, Kashanchi F. Effect of SWI/SNF chromatin remodeling complex on HIV-1 Tat activated transcription. Retrovirology. 2006;3:48. - PMC - PubMed
    1. Aggarwal BB. Nuclear factor-kappaB: the enemy within. Cancer Cell. 2004;6:203–208. - PubMed
    1. Alexaki A, Liu Y, Wigdahl B. Cellular reservoirs of HIV-1 and their role in viral persistence. Curr HIV Res. 2008;6:388–400. - PMC - PubMed
    1. Allers K, Hutter G, Hofmann J, Loddenkemper C, Rieger K, Thiel E, Schneider T. Evidence for the cure of HIV infection by CCR5Delta32/Delta32 stem cell transplantation. Blood. 2011;117:2791–2799. - PubMed
    1. Altschuler C, Resbeut M, Maraninchi D, Guillet JP, Blaise D, Stoppa AM, Carcassonne Y. Fractionated total body irradiation and allogeneic bone marrow transplantation for standard risk leukemia. Radiother Oncol. 1989;16:289–295. - PubMed

Publication types

MeSH terms