

Intracellular oxygen determined by respiration regulates localization of Ras and prenylated proteins
- PMID: 26181205
- PMCID: PMC4650746
- DOI: 10.1038/cddis.2015.64
Intracellular oxygen determined by respiration regulates localization of Ras and prenylated proteins
Abstract
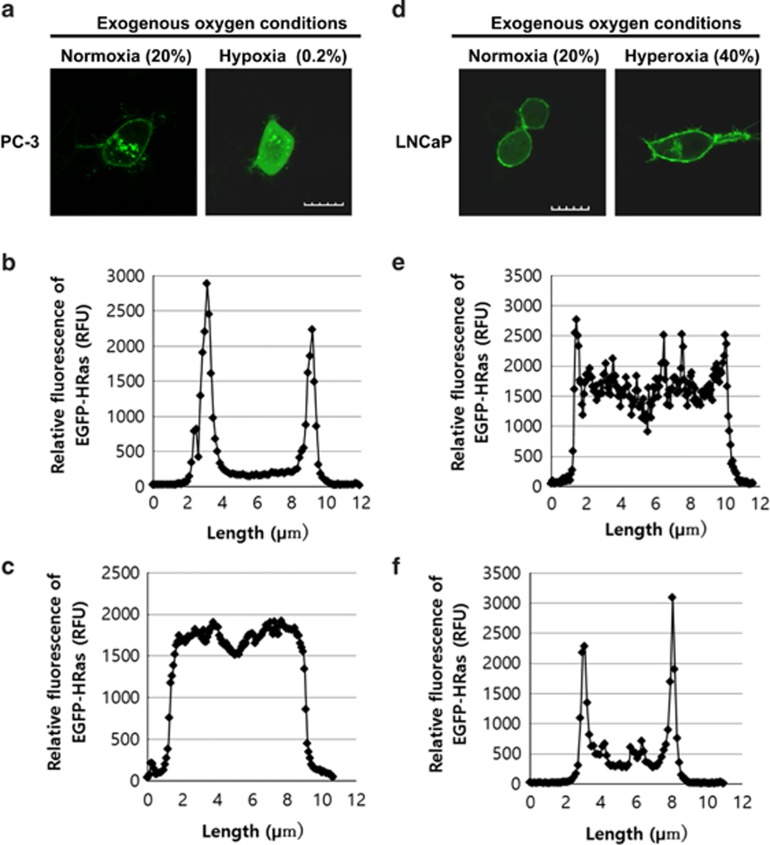
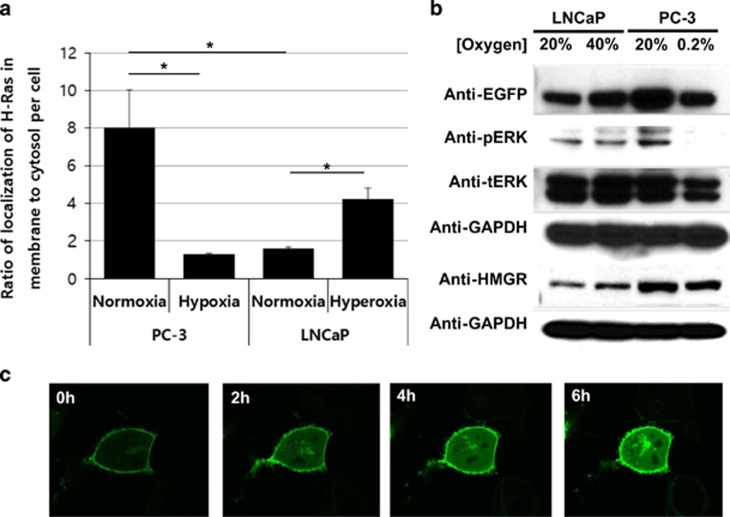
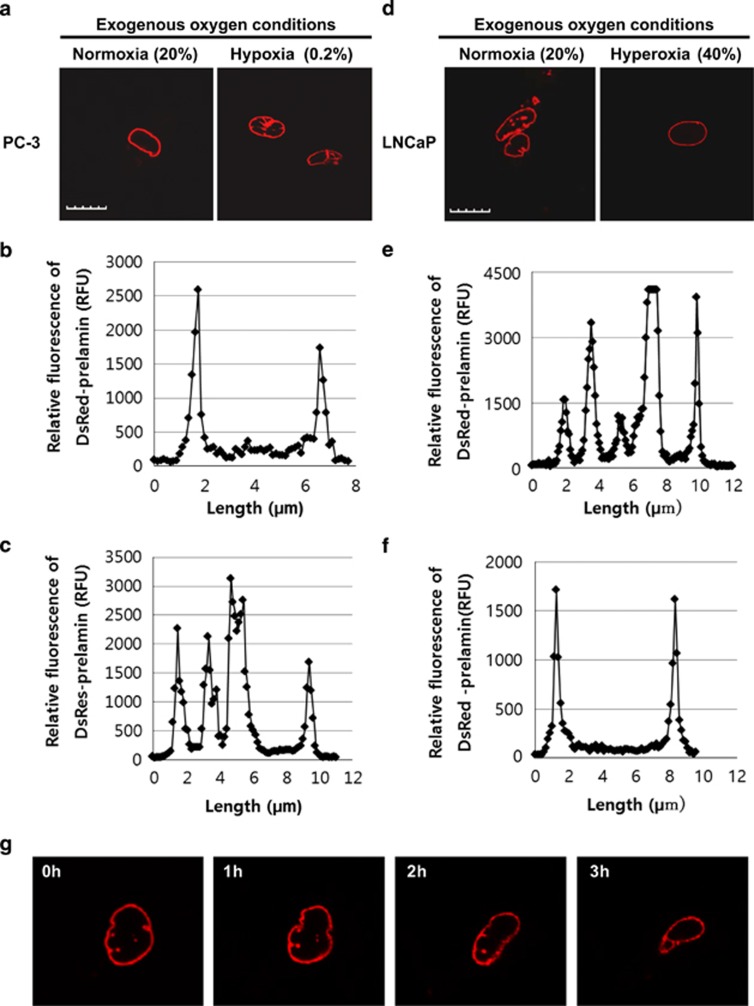
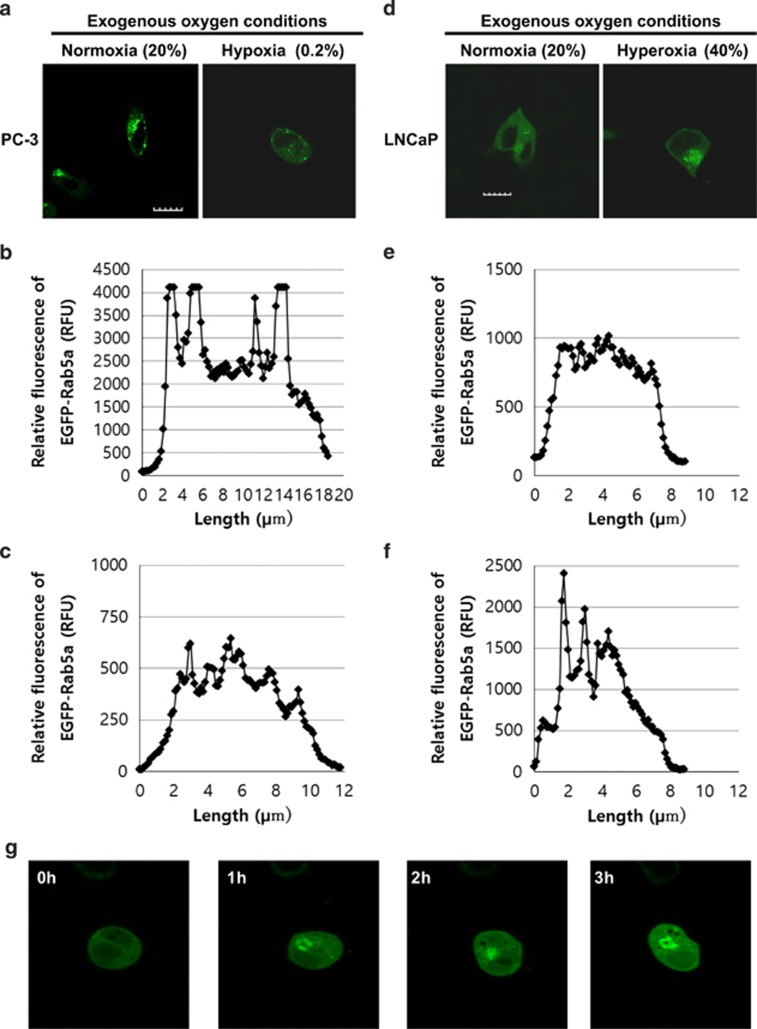
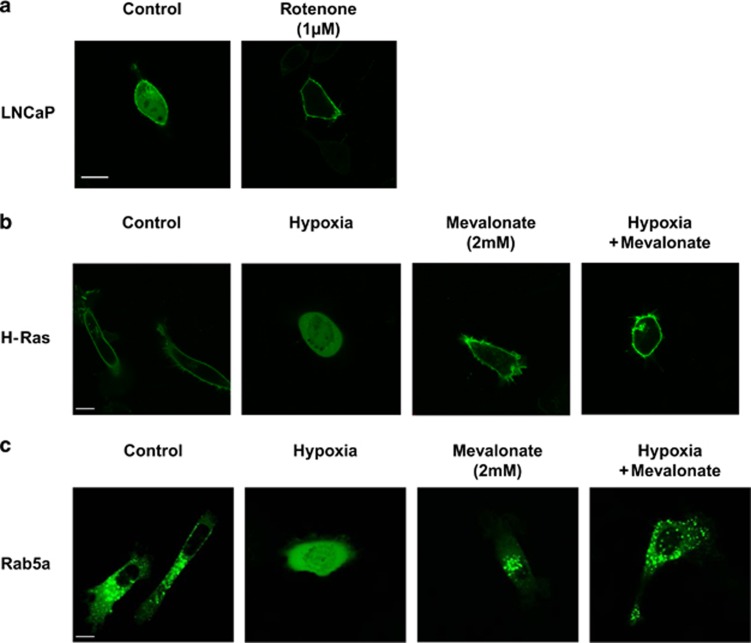
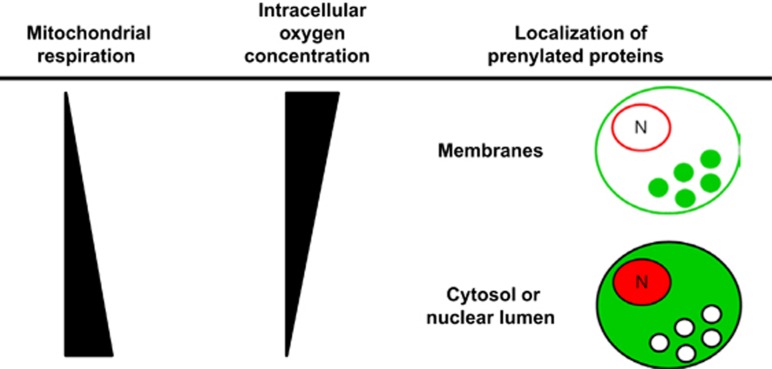
Reduction of mitochondrial DNA (mtDNA) content induces the reduction of oxidative phosphorylation and dependence on fermentative glycolysis, that is, the Warburg effect. In aggressive prostate cancer (PCa), the reduction of mtDNA reduces oxygen consumption, increases intracellular oxygen concentration, and induces constitutive activation of Ras. Many essential proteins for cell death, growth, differentiation, and development, such as Ras, require prenylation for subcellular localization and activation. Prenylation of a protein is defined as the attachment of isoprenoids to a cysteine residue at or near the C-terminus. 3-Hydroxy-3-methyl-glutaryl-coenzyme A reductase (HMGR) produces isoprenoids, and is posttranslationally regulated by oxygen. We investigated a critical role of intracellular oxygen in membrane localization of prenylated proteins. Localization of prenylated proteins (H-Ras, prelamin A/C, and Rab5a) was observed in poorly differentiated PCa (PC-3) and well-differentiated PCa (LNCaP) cells. PC-3 cells exhibited high intracellular oxygen concentration, and H-Ras, prelamin A/C, and Rab5a were localized to various membranes (Golgi and plasma membrane, nuclear membrane, and early endosomes, respectively). Remarkably, exogenous hypoxia (0.2% O2) in PC-3 cells induced intracellular hypoxia and changed the localization of the prenylated proteins. H-Ras and Rab5a were translocated to cytosol, and prelamin A/C was in the nucleus forming an abnormal nuclear envelope. The localization was reversed by mevalonate indicating the involvement of mevalonate pathway. In contrast, in LNCaP cells, exhibiting low intracellular oxygen concentration, H-Ras and Rab5a were localized in the cytosol, and prelamin A/C was inside the nucleus forming an inadequate nuclear envelope. Exogenous hyperoxia (40% O2) increased the intracellular oxygen concentration and induced Ras translocation from cytosol to the membrane. Prelamin A/C was translocated to the nuclear membrane and formed a proper nuclear envelope. Rab5a was translocated to the early endosomes. The specific localizations of the prenylated proteins were dependent on intracellular oxygen concentration. These results demonstrate that intracellular oxygen concentration regulates the localization and activation of prenylated proteins.
Figures

Similar articles
-
Consumption of oxygen: a mitochondrial-generated progression signal of advanced cancer.Cell Death Dis. 2012 Jan 19;3(1):e258. doi: 10.1038/cddis.2011.141. Cell Death Dis. 2012. PMID: 22258408 Free PMC article.
-
Lycopene induces cell growth inhibition by altering mevalonate pathway and Ras signaling in cancer cell lines.Carcinogenesis. 2010 Oct;31(10):1813-21. doi: 10.1093/carcin/bgq157. Epub 2010 Aug 10. Carcinogenesis. 2010. PMID: 20699249
-
Dynamics of rab5 activation in endocytosis and phagocytosis.J Leukoc Biol. 2000 Nov;68(5):627-32. J Leukoc Biol. 2000. PMID: 11073100
-
Isoprenoids and Ras: potential role in chronic rejection.Kidney Int Suppl. 1995 Dec;52:S29-33. Kidney Int Suppl. 1995. PMID: 8587279 Review.
-
Protein prenylation: molecular mechanisms and functional consequences.Annu Rev Biochem. 1996;65:241-69. doi: 10.1146/annurev.bi.65.070196.001325. Annu Rev Biochem. 1996. PMID: 8811180 Review.
Cited by
-
Intracellular Oxygen Concentration Determined By Mitochondrial Respiration Regulates Production of Reactive Oxygen Species.Integr Cancer Biol Res. 2017;1(1):006. Integr Cancer Biol Res. 2017. PMID: 30637413 Free PMC article.
-
Subcellular Distribution of S-Nitrosylated H-Ras in Differentiated and Undifferentiated PC12 Cells during Hypoxia.Cell J. 2017 Oct;19(3):443-451. doi: 10.22074/cellj.2017.4546. Epub 2017 Aug 19. Cell J. 2017. PMID: 28836406 Free PMC article.
-
Shining New Light on Biological Systems: Luminescent Transition Metal Complexes for Bioimaging and Biosensing Applications.Chem Rev. 2024 Aug 14;124(15):8825-9014. doi: 10.1021/acs.chemrev.3c00629. Epub 2024 Jul 25. Chem Rev. 2024. PMID: 39052606 Free PMC article. Review.
-
Cysteine-based regulation of redox-sensitive Ras small GTPases.Redox Biol. 2019 Sep;26:101282. doi: 10.1016/j.redox.2019.101282. Epub 2019 Jul 25. Redox Biol. 2019. PMID: 31386964 Free PMC article. Review.
-
Sphingolipid accumulation causes mitochondrial dysregulation and cell death.Cell Death Differ. 2017 Dec;24(12):2044-2053. doi: 10.1038/cdd.2017.128. Epub 2017 Aug 11. Cell Death Differ. 2017. PMID: 28800132 Free PMC article.
References
-
- 2Warburg O. On the origin of cancer cells. Science 1956; 123: 309–314. - PubMed
Publication types
MeSH terms
Substances
Grants and funding
LinkOut - more resources
Full Text Sources
Other Literature Sources
Medical
Research Materials
Miscellaneous
