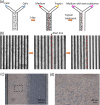
Quantitative impedimetric monitoring of cell migration under the stimulation of cytokine or anti-cancer drug in a microfluidic chip
- PMID: 26180566
- PMCID: PMC4464059
- DOI: 10.1063/1.4922488
Quantitative impedimetric monitoring of cell migration under the stimulation of cytokine or anti-cancer drug in a microfluidic chip
Abstract
Cell migration is a cellular response and results in various biological processes such as cancer metastasis, that is, the primary cause of death for cancer patients. Quantitative investigation of the correlation between cell migration and extracellular stimulation is essential for developing effective therapeutic strategies for controlling invasive cancer cells. The conventional method to determine cell migration rate based on comparison of successive images may not be an objective approach. In this work, a microfluidic chip embedded with measurement electrodes has been developed to quantitatively monitor the cell migration activity based on the impedimetric measurement technique. A no-damage wound was constructed by microfluidic phenomenon and cell migration activity under the stimulation of cytokine and an anti-cancer drug, i.e., interleukin-6 and doxorubicin, were, respectively, investigated. Impedance measurement was concurrently performed during the cell migration process. The impedance change was directly correlated to the cell migration activity; therefore, the migration rate could be calculated. In addition, a good match was found between impedance measurement and conventional imaging analysis. But the impedimetric measurement technique provides an objective and quantitative measurement. Based on our technique, cell migration rates were calculated to be 8.5, 19.1, and 34.9 μm/h under the stimulation of cytokine at concentrations of 0 (control), 5, and 10 ng/ml. This technique has high potential to be developed into a powerful analytical platform for cancer research.
Figures


Similar articles
-
Impedimetric quantification of migration speed of cancer cells migrating along a Matrigel-filled microchannel.Anal Chim Acta. 2020 Jul 18;1121:67-73. doi: 10.1016/j.aca.2020.05.005. Epub 2020 May 5. Anal Chim Acta. 2020. PMID: 32493591
-
Real-time and non-invasive impedimetric monitoring of cell proliferation and chemosensitivity in a perfusion 3D cell culture microfluidic chip.Biosens Bioelectron. 2014 Jan 15;51:16-21. doi: 10.1016/j.bios.2013.07.031. Epub 2013 Jul 20. Biosens Bioelectron. 2014. PMID: 23920091
-
Quantitative Study of Cell Invasion Process under Extracellular Stimulation of Cytokine in a Microfluidic Device.Sci Rep. 2016 May 6;6:25557. doi: 10.1038/srep25557. Sci Rep. 2016. PMID: 27150137 Free PMC article.
-
[Laboratory on a microfluidic chip].Se Pu. 2005 Sep;23(5):456-63. Se Pu. 2005. PMID: 16350786 Review. Chinese.
-
Cell Migration Research Based on Organ-on-Chip-Related Approaches.Micromachines (Basel). 2017 Oct 31;8(11):324. doi: 10.3390/mi8110324. Micromachines (Basel). 2017. PMID: 30400514 Free PMC article. Review.
Cited by
-
Quantitative investigation of MDA-MB-231 breast cancer cell motility: dependence on epidermal growth factor concentration and its gradient.Mol Biosyst. 2017 Sep 26;13(10):2069-2082. doi: 10.1039/c7mb00390k. Mol Biosyst. 2017. PMID: 28799616 Free PMC article.
-
A Review on Microfluidics-Based Impedance Biosensors.Biosensors (Basel). 2023 Jan 3;13(1):83. doi: 10.3390/bios13010083. Biosensors (Basel). 2023. PMID: 36671918 Free PMC article. Review.
-
The Current Trends of Biosensors in Tissue Engineering.Biosensors (Basel). 2020 Aug 3;10(8):88. doi: 10.3390/bios10080088. Biosensors (Basel). 2020. PMID: 32756393 Free PMC article. Review.
References
LinkOut - more resources
Full Text Sources
Other Literature Sources
