MicroRNA-375 Suppresses Extracellular Matrix Degradation and Invadopodial Activity in Head and Neck Squamous Cell Carcinoma
- PMID: 26172508
- PMCID: PMC4628565
- DOI: 10.5858/arpa.2014-0471-OA
MicroRNA-375 Suppresses Extracellular Matrix Degradation and Invadopodial Activity in Head and Neck Squamous Cell Carcinoma
Abstract
Context: Head and neck squamous cell carcinoma (HNSCC) is a highly invasive cancer with an association with locoregional recurrence and lymph node metastasis. We have previously reported that low microRNA-375 (miR-375) expression levels correlate with poor patient survival, increased locoregional recurrence, and distant metastasis. Increasing miR-375 expression in HNSCC cell lines to levels found in normal cells results in suppressed invasive properties. HNSCC invasion is mediated in part by invadopodia-associated degradation of the extracellular matrix.
Objective: To determine whether elevated miR-375 expression in HNSCC cell lines also affects invadopodia formation and activity.
Design: For evaluation of the matrix degradation properties of the HNSCC lines, an invadopodial matrix degradation assay was used. The total protein levels of invadopodia-associated proteins were measured by Western blot analyses. Immunoprecipitation experiments were conducted to evaluate the tyrosine phosphorylation state of cortactin. Human protease arrays were used for the detection of the secreted proteases. Quantitative real time-polymerase chain reaction measurements were used to evaluate the messenger RNA (mRNA) expression of the commonly regulated proteases.
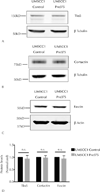
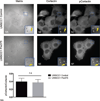
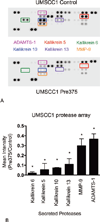
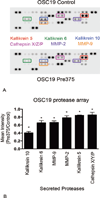
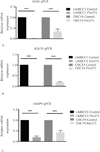
Results: Increased miR-375 expression in HNSCC cells suppresses extracellular matrix degradation and reduces the number of mature invadopodia. Higher miR-375 expression does not reduce cellular levels of selected invadopodia-associated proteins, nor is tyrosine phosphorylation of cortactin altered. However, HNSCC cells with higher miR-375 expression had significant reductions in the mRNA expression levels and secreted levels of specific proteases.
Conclusions: MicroRNA-375 regulates invadopodia maturation and function potentially by suppressing the expression and secretion of proteases.
Figures



Similar articles
-
Cortactin is an essential regulator of matrix metalloproteinase secretion and extracellular matrix degradation in invadopodia.Cancer Res. 2007 May 1;67(9):4227-35. doi: 10.1158/0008-5472.CAN-06-3928. Cancer Res. 2007. PMID: 17483334
-
microRNA-203 suppresses invasion and epithelial-mesenchymal transition induction via targeting NUAK1 in head and neck cancer.Oncotarget. 2016 Feb 16;7(7):8223-39. doi: 10.18632/oncotarget.6972. Oncotarget. 2016. PMID: 26882562 Free PMC article. Clinical Trial.
-
Ableson kinases negatively regulate invadopodia function and invasion in head and neck squamous cell carcinoma by inhibiting an HB-EGF autocrine loop.Oncogene. 2013 Oct;32(40):4766-77. doi: 10.1038/onc.2012.513. Epub 2012 Nov 12. Oncogene. 2013. PMID: 23146907 Free PMC article.
-
Mechanisms of Invasion in Head and Neck Cancer.Arch Pathol Lab Med. 2015 Nov;139(11):1334-48. doi: 10.5858/arpa.2014-0498-RA. Epub 2015 Jun 5. Arch Pathol Lab Med. 2015. PMID: 26046491 Free PMC article. Review.
-
HGF and c-MET as potential orchestrators of invasive growth in head and neck squamous cell carcinoma.Front Biosci. 2008 Jan 1;13:2516-26. doi: 10.2741/2863. Front Biosci. 2008. PMID: 17981731 Review.
Cited by
-
Reactivation of super-enhancers by KLF4 in human Head and Neck Squamous Cell Carcinoma.Oncogene. 2020 Jan;39(2):262-277. doi: 10.1038/s41388-019-0990-4. Epub 2019 Sep 2. Oncogene. 2020. PMID: 31477832
-
Serum expression of Vascular Endothelial-Cadherin, CD44, Human High mobility group B1, Kallikrein 6 proteins in different stages of laryngeal intraepithelial lesions and early glottis cancer.PeerJ. 2022 Apr 19;10:e13104. doi: 10.7717/peerj.13104. eCollection 2022. PeerJ. 2022. PMID: 35462765 Free PMC article.
-
MicroRNA-375 inhibits laryngeal squamous cell carcinoma progression via targeting CST1.Braz J Otorhinolaryngol. 2022 Nov-Dec;88 Suppl 4(Suppl 4):S108-S116. doi: 10.1016/j.bjorl.2022.06.005. Epub 2022 Jul 6. Braz J Otorhinolaryngol. 2022. PMID: 35953439 Free PMC article.
-
Effect of selective small molecule inhibitors on MMP-9 and VEGFR-1 expression in p16-positive and -negative squamous cell carcinoma.Oncol Lett. 2017 May;13(5):3269-3276. doi: 10.3892/ol.2017.5844. Epub 2017 Mar 13. Oncol Lett. 2017. PMID: 28521433 Free PMC article.
-
MicroRNA-375 targets PAX6 and inhibits the viability, migration and invasion of human breast cancer MCF-7 cells.Exp Ther Med. 2017 Aug;14(2):1198-1204. doi: 10.3892/etm.2017.4593. Epub 2017 Jun 13. Exp Ther Med. 2017. Retraction in: Exp Ther Med. 2021 Oct;22(4):1169. doi: 10.3892/etm.2021.10603 PMID: 28810579 Free PMC article. Retracted.
References
-
- Siegel R, Naishadham D, Jemal A. Cancer statistics, 2013. CA Cancer J Clin. 2013;63(1):11–30. - PubMed
-
- Url C, Schartinger VH, Riechelmann H, et al. Radiological detection of extracapsular spread in head and neck squamous cell carcinoma (HNSCC) cervical metastases. Eur J Radiol. 2013;82(10):1783–1787. - PubMed
-
- Tabor MP, Brakenhoff RH, Ruijter-Schippers HJ, Kummer JA, Leemans CR, Braakhuis BJ. Genetically altered fields as origin of locally recurrent head and neck cancer: a retrospective study. Clin Cancer Res. 2004;10(11):3607–3613. - PubMed
-
- Braakhuis BJ, Tabor MP, Kummer JA, Leemans CR, Brakenhoff RH. A genetic explanation of Slaughter’s concept of field cancerization: evidence and clinical implications. Cancer Res. 2003;63(8):1727–1730. - PubMed
Publication types
MeSH terms
Substances
Grants and funding
LinkOut - more resources
Full Text Sources
Miscellaneous

