

The interplay between DNA methylation and sequence divergence in recent human evolution
- PMID: 26170231
- PMCID: PMC4787803
- DOI: 10.1093/nar/gkv693
The interplay between DNA methylation and sequence divergence in recent human evolution
Abstract
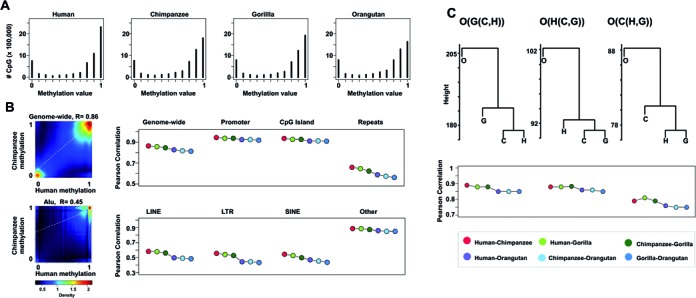
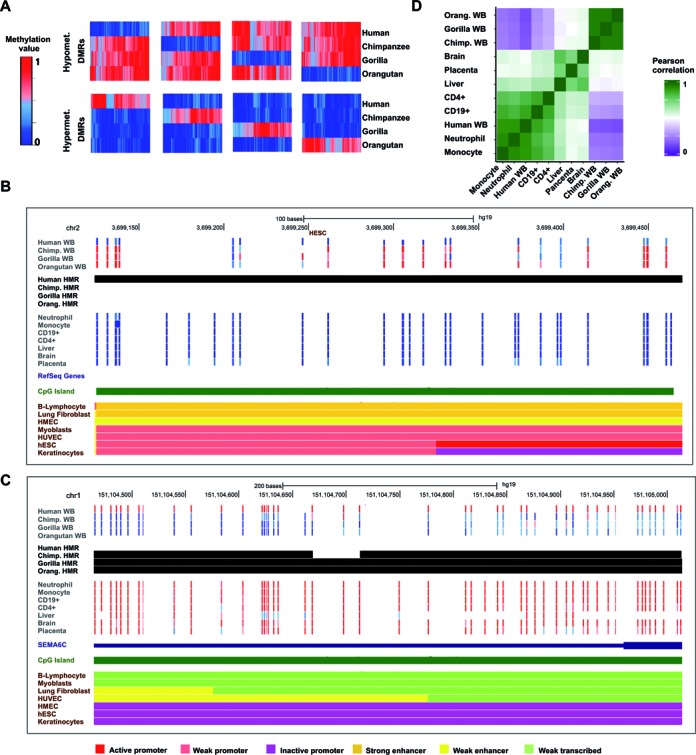
Despite the increasing knowledge about DNA methylation, the understanding of human epigenome evolution is in its infancy. Using whole genome bisulfite sequencing we identified hundreds of differentially methylated regions (DMRs) in humans compared to non-human primates and estimated that ∼25% of these regions were detectable throughout several human tissues. Human DMRs were enriched for specific histone modifications and the majority were located distal to transcription start sites, highlighting the importance of regions outside the direct regulatory context. We also found a significant excess of endogenous retrovirus elements in human-specific hypomethylated.We reported for the first time a close interplay between inter-species genetic and epigenetic variation in regions of incomplete lineage sorting, transcription factor binding sites and human differentially hypermethylated regions. Specifically, we observed an excess of human-specific substitutions in transcription factor binding sites located within human DMRs, suggesting that alteration of regulatory motifs underlies some human-specific methylation patterns. We also found that the acquisition of DNA hypermethylation in the human lineage is frequently coupled with a rapid evolution at nucleotide level in the neighborhood of these CpG sites. Taken together, our results reveal new insights into the mechanistic basis of human-specific DNA methylation patterns and the interpretation of inter-species non-coding variation.
© The Author(s) 2015. Published by Oxford University Press on behalf of Nucleic Acids Research.
Figures


Similar articles
-
Evolution of the sperm methylome of primates is associated with retrotransposon insertions and genome instability.Hum Mol Genet. 2017 Sep 15;26(18):3508-3519. doi: 10.1093/hmg/ddx236. Hum Mol Genet. 2017. PMID: 28637190
-
Comparative Methylome Analyses Identify Epigenetic Regulatory Loci of Human Brain Evolution.Mol Biol Evol. 2016 Nov;33(11):2947-2959. doi: 10.1093/molbev/msw176. Epub 2016 Aug 25. Mol Biol Evol. 2016. PMID: 27563052 Free PMC article.
-
Genome-wide DNA methylation analyses in the brain reveal four differentially methylated regions between humans and non-human primates.BMC Evol Biol. 2012 Aug 16;12:144. doi: 10.1186/1471-2148-12-144. BMC Evol Biol. 2012. PMID: 22899776 Free PMC article.
-
Interplay between DNA methylation, histone modification and chromatin remodeling in stem cells and during development.Int J Dev Biol. 2009;53(2-3):203-14. doi: 10.1387/ijdb.082741ki. Int J Dev Biol. 2009. PMID: 19412882 Review.
-
Insights in human epigenomic dynamics through comparative primate analysis.Genomics. 2016 Oct;108(3-4):115-125. doi: 10.1016/j.ygeno.2016.09.003. Epub 2016 Oct 1. Genomics. 2016. PMID: 27702613 Review.
Cited by
-
Age-associated epigenetic change in chimpanzees and humans.Philos Trans R Soc Lond B Biol Sci. 2020 Nov 9;375(1811):20190616. doi: 10.1098/rstb.2019.0616. Epub 2020 Sep 21. Philos Trans R Soc Lond B Biol Sci. 2020. PMID: 32951551 Free PMC article.
-
The Spectrum of CHM Gene Mutations in Choroideremia and Their Relationship to Clinical Phenotype.Invest Ophthalmol Vis Sci. 2016 Nov 1;57(14):6033-6039. doi: 10.1167/iovs.16-20230. Invest Ophthalmol Vis Sci. 2016. PMID: 27820636 Free PMC article. Clinical Trial.
-
High levels of circulating folate concentrations are associated with DNA methylation of tumor suppressor and repair genes p16, MLH1, and MGMT in elderly Chileans.Clin Epigenetics. 2017 Jul 24;9:74. doi: 10.1186/s13148-017-0374-y. eCollection 2017. Clin Epigenetics. 2017. PMID: 28748002 Free PMC article. Clinical Trial.
-
Evolution of DNA Methylation in Papio Baboons.Mol Biol Evol. 2019 Mar 1;36(3):527-540. doi: 10.1093/molbev/msy227. Mol Biol Evol. 2019. PMID: 30521003 Free PMC article.
-
Sequence features of retrotransposons allow for epigenetic variability.Elife. 2021 Oct 20;10:e71104. doi: 10.7554/eLife.71104. Elife. 2021. PMID: 34668484 Free PMC article.
References
-
- Sequencing T.C., Consortium A. Initial sequence of the chimpanzee genome and comparison with the human genome. Nature. 2005;437:69–87. - PubMed
-
- King M., Wilson A.C. Evolution at Two Levels. Science. 1975;188:107–116. - PubMed
-
- Jones P.A. Functions of DNA methylation: islands, start sites, gene bodies and beyond. Nat. Rev. Genet. 2012;13:484–492. - PubMed
-
- Portela A., Esteller M. Epigenetic modifications and human disease. Nat. Biotechnol. 2010;28:1057–1068. - PubMed
-
- Reik W. Stability and flexibility of epigenetic gene regulation in mammalian development. Nature. 2007;447:425–432. - PubMed
Publication types
MeSH terms
Associated data
LinkOut - more resources
Full Text Sources
Other Literature Sources
