

Budgett's frog (Lepidobatrachus laevis): A new amphibian embryo for developmental biology
- PMID: 26169245
- PMCID: PMC4670266
- DOI: 10.1016/j.ydbio.2015.06.007
Budgett's frog (Lepidobatrachus laevis): A new amphibian embryo for developmental biology
Abstract
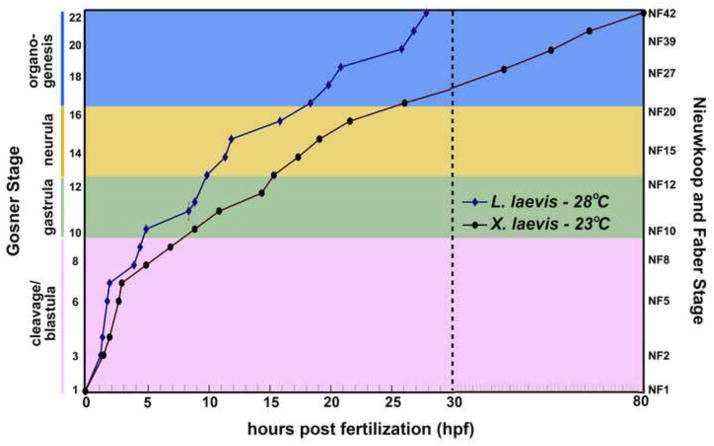
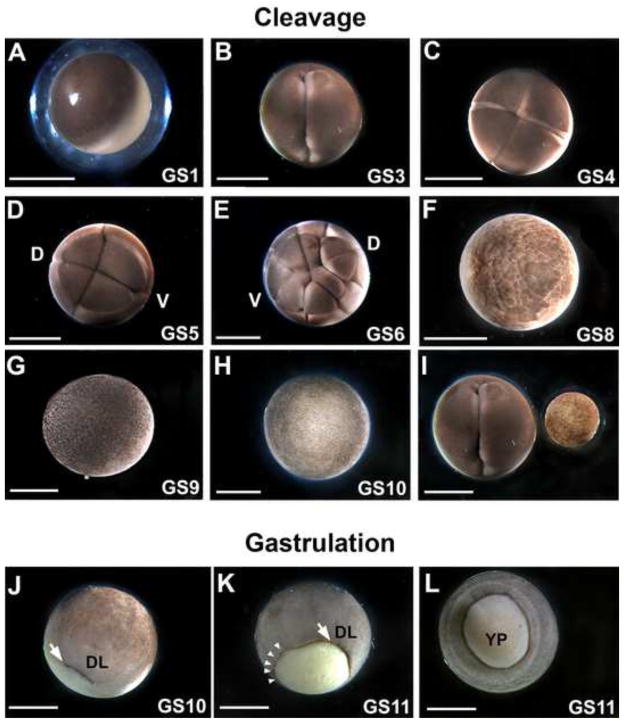
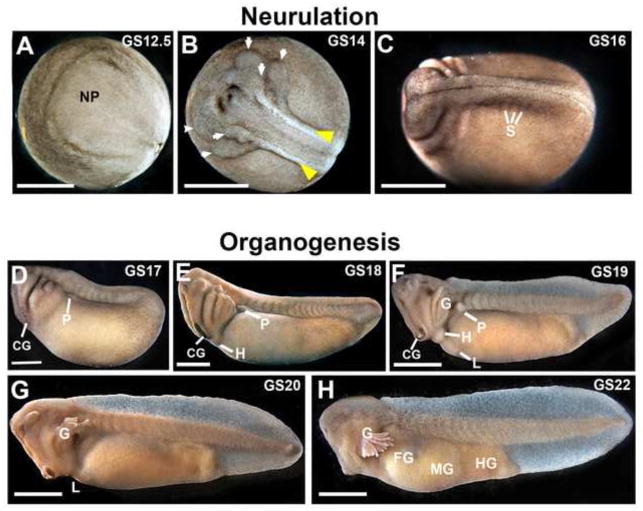
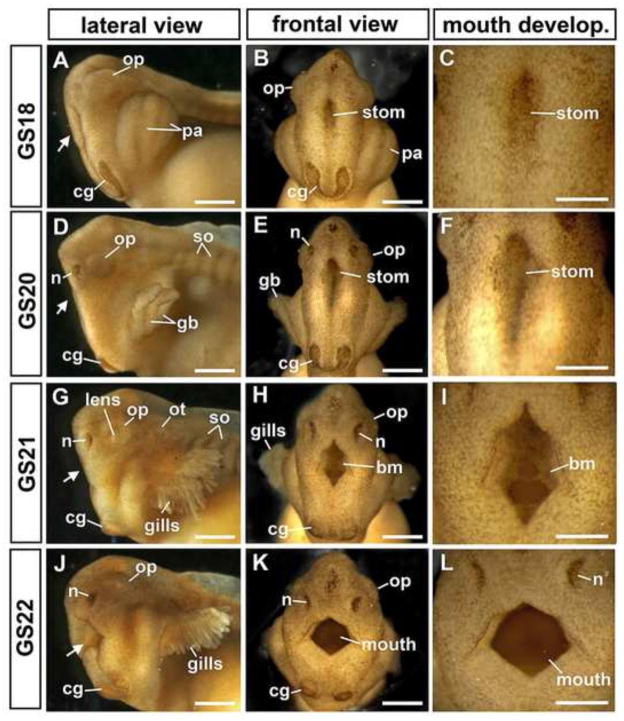
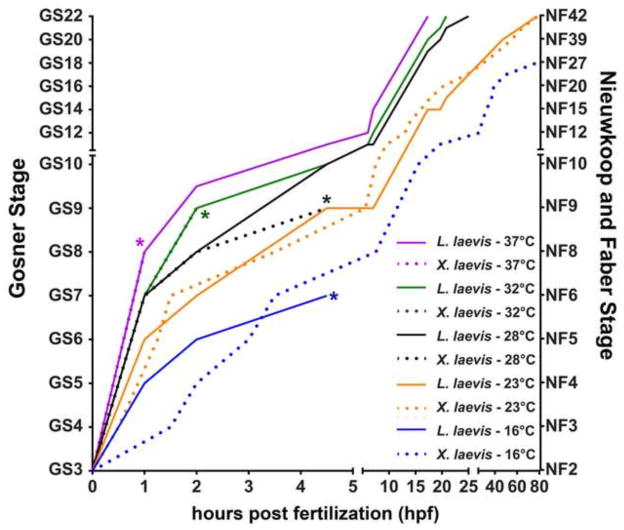
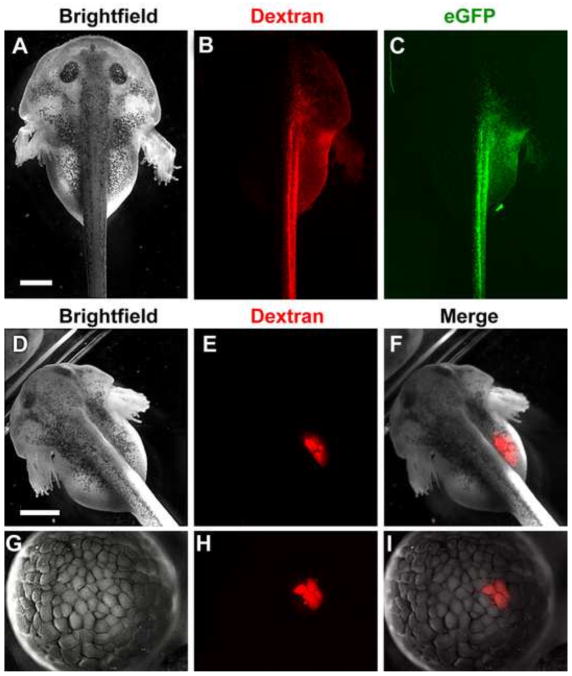
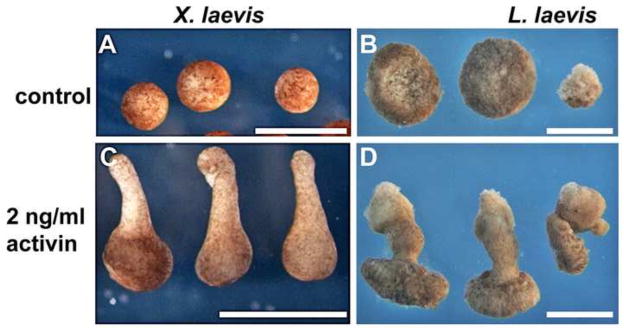
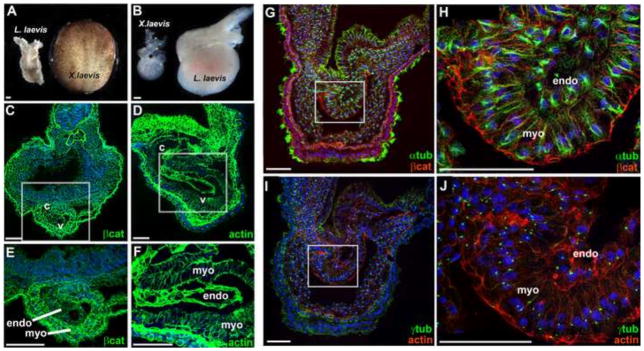
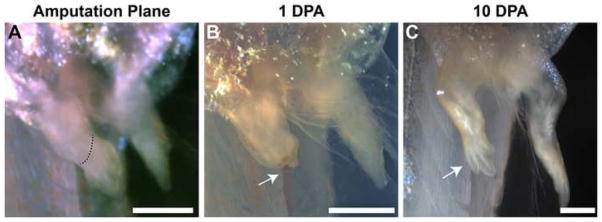
The large size and rapid development of amphibian embryos has facilitated ground-breaking discoveries in developmental biology. Here, we describe the embryogenesis of the Budgett's frog (Lepidobatrachus laevis), an unusual species with eggs that are over twice the diameter of laboratory Xenopus, and embryos that can tolerate higher temperatures to develop into a tadpole four times more rapidly. In addition to detailing their early development, we demonstrate that, like Xenopus, these embryos are amenable to explant culture assays and can express exogenous transcripts in a tissue-specific manner. Moreover, the steep developmental trajectory and large scale of Lepidobatrachus make it exceptionally well-suited for morphogenesis research. For example, the developing organs of the Budgett's frog are massive compared to those of most model species, and are composed of larger individual cells, thereby affording increased subcellular resolution of early vertebrate organogenesis. Furthermore, we found that complete limb regeneration, which typically requires months to achieve in most vertebrate models, occurs in a matter of days in the Budgett's tadpole, which substantially accelerates the pace of experimentation. Thus, the unusual combination of the greater size and speed of the Budgett's frog model provides inimitable advantages for developmental studies-and a novel inroad to address the mechanisms of spatiotemporal scaling during evolution.
Keywords: Amphibian; Embryo; Lepidobatrachus; Scaling; Stages; Xenopus.
Copyright © 2015 Elsevier Inc. All rights reserved.
Figures
Similar articles
-
Developmental sequence of the chondrocranium in the obligate carnivorous larvae of Lepidobatrachus laevis (Amphibia: Ceratophryidae).Anat Rec (Hoboken). 2025 Jan;308(1):26-44. doi: 10.1002/ar.25535. Epub 2024 Jul 19. Anat Rec (Hoboken). 2025. PMID: 39030935 Free PMC article.
-
Depressing time: Waiting, melancholia, and the psychoanalytic practice of care.In: Kirtsoglou E, Simpson B, editors. The Time of Anthropology: Studies of Contemporary Chronopolitics. Abingdon: Routledge; 2020. Chapter 5. In: Kirtsoglou E, Simpson B, editors. The Time of Anthropology: Studies of Contemporary Chronopolitics. Abingdon: Routledge; 2020. Chapter 5. PMID: 36137063 Free Books & Documents. Review.
-
Far Posterior Approach for Rib Fracture Fixation: Surgical Technique and Tips.JBJS Essent Surg Tech. 2024 Dec 6;14(4):e23.00094. doi: 10.2106/JBJS.ST.23.00094. eCollection 2024 Oct-Dec. JBJS Essent Surg Tech. 2024. PMID: 39650795 Free PMC article.
-
"It Is a Big Spider Web of Things": Sensory Experiences of Autistic Adults in Public Spaces.Autism Adulthood. 2023 Dec 1;5(4):411-422. doi: 10.1089/aut.2022.0024. Epub 2023 Dec 12. Autism Adulthood. 2023. PMID: 38116051 Free PMC article.
-
Trends in Surgical and Nonsurgical Aesthetic Procedures: A 14-Year Analysis of the International Society of Aesthetic Plastic Surgery-ISAPS.Aesthetic Plast Surg. 2024 Oct;48(20):4217-4227. doi: 10.1007/s00266-024-04260-2. Epub 2024 Aug 5. Aesthetic Plast Surg. 2024. PMID: 39103642 Review.
Cited by
-
Developmental changes and novelties in ceratophryid frogs.Evodevo. 2016 Feb 27;7:5. doi: 10.1186/s13227-016-0043-9. eCollection 2016. Evodevo. 2016. PMID: 26925212 Free PMC article. Review.
-
Jak2 and Jaw Muscles Are Required for Buccopharyngeal Membrane Perforation during Mouth Development.J Dev Biol. 2023 May 31;11(2):24. doi: 10.3390/jdb11020024. J Dev Biol. 2023. PMID: 37367478 Free PMC article.
-
To regenerate or not to regenerate: Vertebrate model organisms of regeneration-competency and -incompetency.Wound Repair Regen. 2022 Nov;30(6):623-635. doi: 10.1111/wrr.13000. Epub 2022 Feb 22. Wound Repair Regen. 2022. PMID: 35192230 Free PMC article. Review.
-
Using frogs faces to dissect the mechanisms underlying human orofacial defects.Semin Cell Dev Biol. 2016 Mar;51:54-63. doi: 10.1016/j.semcdb.2016.01.016. Epub 2016 Jan 15. Semin Cell Dev Biol. 2016. PMID: 26778163 Free PMC article. Review.
-
Pathologic Lesions of the Budgett Frog (Lepidobatrachus laevis), an Emerging Laboratory Animal Model.Comp Med. 2020 Jun 1;70(3):239-247. doi: 10.30802/AALAS-CM-19-000071. Epub 2020 Mar 31. Comp Med. 2020. PMID: 32234112 Free PMC article.
References
-
- Amaya E, Musci TJ, Kirschner MW. Expression of a dominant negative mutant of the FGF receptor disrupts mesoderm formation in Xenopus embryos. Cell. 1991;66:257–270. - PubMed
-
- AmphibiaWeb. Information on amphibian biology and conservation. Berkeley, California: AmphibiaWeb; Dec 15, 2014.
-
- Beck CW. Studying regeneration in Xenopus. Methods Mol Biol. 2012;917:525–39. - PubMed
Publication types
MeSH terms
Grants and funding
LinkOut - more resources
Full Text Sources
Other Literature Sources
