Spatial Regulation of Kinetochore Microtubule Attachments by Destabilization at Spindle Poles in Meiosis I
- PMID: 26166779
- PMCID: PMC4519087
- DOI: 10.1016/j.cub.2015.05.013
Spatial Regulation of Kinetochore Microtubule Attachments by Destabilization at Spindle Poles in Meiosis I
Abstract
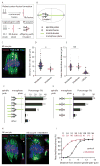
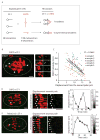
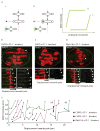
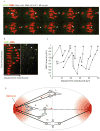
To ensure accurate chromosome segregation in cell division, erroneous kinetochore-microtubule (MT) attachments are recognized and destabilized . Improper attachments typically lack tension between kinetochores and are positioned off-center on the spindle. Low tension is a widely accepted mechanism for recognizing errors , but whether chromosome position regulates MT attachments has been difficult to test. We exploited a meiotic system in which kinetochores attached to opposite spindle poles differ in their interactions with MTs and therefore position and tension can be uncoupled. In this system, homologous chromosomes are positioned off-center on the spindle in oocytes in meiosis I, while under normal tension, as a result of crossing mouse strains with different centromere strengths, manifested by unequal kinetochore protein levels. We show that proximity to spindle poles destabilizes kinetochore-MTs and that stable attachments are restored by inhibition of Aurora A kinase at spindle poles. During the correction of attachment errors, kinetochore-MTs detach near spindle poles to allow formation of correct attachments. We propose that chromosome position on the spindle provides spatial cues for the fidelity of cell division.
Copyright © 2015 Elsevier Ltd. All rights reserved.
Figures


Comment in
-
Chromosome Segregation: A Spatial Code to Correct Kinetochore-Microtubule Attachments.Curr Biol. 2015 Jul 20;25(14):R601-3. doi: 10.1016/j.cub.2015.05.056. Curr Biol. 2015. PMID: 26196485
Similar articles
-
Chromosome Segregation: A Spatial Code to Correct Kinetochore-Microtubule Attachments.Curr Biol. 2015 Jul 20;25(14):R601-3. doi: 10.1016/j.cub.2015.05.056. Curr Biol. 2015. PMID: 26196485
-
Shake It Off: The Elimination of Erroneous Kinetochore-Microtubule Attachments and Chromosome Oscillation.Int J Mol Sci. 2021 Mar 20;22(6):3174. doi: 10.3390/ijms22063174. Int J Mol Sci. 2021. PMID: 33804687 Free PMC article. Review.
-
Erroneous Silencing of the Mitotic Checkpoint by Aberrant Spindle Pole-Kinetochore Coordination.Biophys J. 2015 Dec 1;109(11):2418-35. doi: 10.1016/j.bpj.2015.10.024. Biophys J. 2015. PMID: 26636952 Free PMC article.
-
Regulation of kinetochore-microtubule attachments by Aurora B kinase.Biochem Soc Trans. 2009 Oct;37(Pt 5):976-80. doi: 10.1042/BST0370976. Biochem Soc Trans. 2009. PMID: 19754435 Review.
-
Chromosome biorientation produces hundreds of piconewtons at a metazoan kinetochore.Nat Commun. 2016 Oct 20;7:13221. doi: 10.1038/ncomms13221. Nat Commun. 2016. PMID: 27762268 Free PMC article.
Cited by
-
Redox priming promotes Aurora A activation during mitosis.Sci Signal. 2020 Jul 21;13(641):eabb6707. doi: 10.1126/scisignal.abb6707. Sci Signal. 2020. PMID: 32694171 Free PMC article.
-
Aurora A Kinase Contributes to a Pole-Based Error Correction Pathway.Curr Biol. 2015 Jul 20;25(14):1842-51. doi: 10.1016/j.cub.2015.06.021. Epub 2015 Jul 9. Curr Biol. 2015. PMID: 26166783 Free PMC article.
-
MKLP2 functions in early mitosis to ensure proper chromosome congression.J Cell Sci. 2022 Jun 15;135(12):jcs259560. doi: 10.1242/jcs.259560. Epub 2022 Jun 29. J Cell Sci. 2022. PMID: 35638575 Free PMC article.
-
Aurora A-dependent CENP-A phosphorylation at inner centromeres protects bioriented chromosomes against cohesion fatigue.Nat Commun. 2018 May 14;9(1):1888. doi: 10.1038/s41467-018-04089-9. Nat Commun. 2018. PMID: 29760389 Free PMC article.
-
Specialize and Divide (Twice): Functions of Three Aurora Kinase Homologs in Mammalian Oocyte Meiotic Maturation.Trends Genet. 2017 May;33(5):349-363. doi: 10.1016/j.tig.2017.03.005. Epub 2017 Mar 27. Trends Genet. 2017. PMID: 28359584 Free PMC article. Review.
References
Publication types
MeSH terms
Grants and funding
LinkOut - more resources
Full Text Sources
Other Literature Sources

