. 2015 Jul 27;34(2):139-151.
doi: 10.1016/j.devcel.2015.05.013. Epub 2015 Jul 9.

Actin filament turnover drives leading edge growth during myelin sheath formation in the central nervous system

Affiliations

Actin filament turnover drives leading edge growth during myelin sheath formation in the central nervous system

Schanila Nawaz et al. Dev Cell. .

Abstract

During CNS development, oligodendrocytes wrap their plasma membrane around axons to generate multilamellar myelin sheaths. To drive growth at the leading edge of myelin at the interface with the axon, mechanical forces are necessary, but the underlying mechanisms are not known. Using an interdisciplinary approach that combines morphological, genetic, and biophysical analyses, we identified a key role for actin filament network turnover in myelin growth. At the onset of myelin biogenesis, F-actin is redistributed to the leading edge, where its polymerization-based forces push out non-adhesive and motile protrusions. F-actin disassembly converts protrusions into sheets by reducing surface tension and in turn inducing membrane spreading and adhesion. We identified the actin depolymerizing factor ADF/cofilin1, which mediates high F-actin turnover rates, as an essential factor in this process. We propose that F-actin turnover is the driving force in myelin wrapping by regulating repetitive cycles of leading edge protrusion and spreading.


Figures

Figure 1
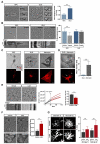
Figure 1. Localization and dynamics of filamentous actin during myelin formation in zebrafish
(A) Left panel, premyelinating oligodendrocyte visualized with membrane-targeted GFP using Tg(nkx2.2a:meGFP); right panel, myelinating oligodendrocyte visualized using Tg(mbp:EGFP-CAAX) zebrafish lines. Zebrafish were injected with a plasmid encoding for Lifeact fused with the red fluorescent protein tag-RFPt under control of sox10 upstream regulatory sequences to localize F-actin. Scale bars, 10 μm. (B) Time-lapse imaging of Lifeact-RFP in Tg(nkx2.2a:meGFP) zebrafish at initial stages of myelination. Lifeact-RFP moves in a spiral pattern longitudinally along the axon. Scale bars, 10 μm; zoom in images, 3 μm. (C) At later stages, using Tg(mbp:EGFP-CAAX and Lifeact-RFP, F-actin is found at the lateral edges – presumably the paranodes – of the myelin sheaths (arrow heads). Scale bar 5 μm. See also Movies S1-S2
Figure 2
Figure 2. F-actin depolymerization triggers cell adhesion and membrane spreading
(A) Live imaging of cell adhesion using interference reflection microscopy (IRM) to visualize membrane dynamics and to measure the inter-surface distances between oligodendrocytes and the substratum. The resulting dark zones in IRM images correspond to close contact, whereas non-adhesive areas appear bright. Images show an oligodendrocyte precursor (OPC) that is starting to extend processes and an oligodendrocyte (OLG) that has already formed processes, but is starting to generate membrane sheets. The inset is an enlarged area of the leading edge of the cells at different time points. Quantification shows an increase of non-adhesive membrane when comparing OPCs with OLGs. Bars represent mean ± SD (n=9-15 cells from each stage, ***p < 0.001, t-test). Scale bar is 10 μm. (B) IRM images of OPCs and OLGs 15 minutes before and after incubation with 200μg/ml trypsin. The kymograph are from the area indicated by white lines in the upper panel. Lower panel, kymograph showing movement 15 minutes before and after treatment, dotted line marks the point when trypsin was added. Quantification of changes in surface area of cells treated with trypsin for 10 minutes. Cell surface area was quantified as described in G and normalized to untreated cells. Bars represent mean ± SD (n=25-38 cells, ***p<0.001, t-test). Scale bar is 10 μm. (C) Vinculin staining (red) of OPCs (left panel) and OLGs (middle panel) grown on poly-L-lysine coated coverslips. Inset shows an enlarged area of the growth-like structure of the OPC. An astrocyte (right panel) is shown as a comparison. Scale bar is 10 μm. (D) Vinculin staining (red) of an oligodendrocyte (arrow head) and an astrocyte (arrow) cultured for 4 days on 100μg/ml poly-L-lysine + 100μg/ml fibronectin coated coverslips. Quantification of mean fluorescent intensity between OLGs and astrocytes. Bars represent mean ± SD (n=14 cells each, ***p<0.001, t-test). Scale bar is 10 μm. (E) IRM was used to quantify changes in cell adhesion in OLGs treated with 10μM latrunculin A (LatA). Quantification shows a decrease in membrane motility and an increase in adhesion area (F) within 30 minutes of incubation with LatA. Bars show mean ± SEM (n=9 cells, **p < 0.01, paired t-test). Scale bar is 10 μm. (G) OLGs cultured for 1-2 days were treated with 10 μM LatA, incubated for 4 hours and labelled with cell mask orange to visualize the cell surface. Cells are depicted as binary image. A circle was fitted around the cell and the cell surface area within the circle was determined and is given in percent. Bars show mean ± SD (n=18-32 measurements, **p < 0.01, ***p < 0.001, t-test). Scale bar is 10 μm. See also Figures S1, S2, Movies S3-S8
Figure 3
Figure 3. F-actin depolymerization reduces membrane tension
(A) To measure surface tension in oligodendrocytes we used an optical trap setup to pull membrane tubes (tethers) in a vertical direction with high force resolution. We cultured cells for 2 and 5 days in vitro (div). Treatment for 2 hours with 5 μM latrunculin A (LatA) and 5 μM cytochalasin D (CytoD) reduced tether forces, whereas 50 μM blebbistatin (Blebb) and 10 μM Y27631 (Y27) had no effect. Static tether force is shown as mean ± SEM (n=37-80 cells for each condition; ***p < 0.001). (B) Atomic force microscopy (AFM) was used to measure membrane tension at different positions of the cell. The measured tether force is shown in relation to the distance from the cell body. Force map of oligodendrocytes cultured for 2 days and treated with latrunculin A, jasplakinolide or vehicle respectively. Tether force is shown as mean ± SEM (n=10-13 cells with a total of 67-245 pulled tethers per treatment). (C) AFM was used to generate force maps of oligodendrocytes cultured for two days (left panel) and five days (right panel). Tether force was anisotropic in sheath forming cells with higher values in the outer cellular rim (**p < 0.01, ***p < 0.001, one-way analysis of variance and Tukey’s multiple comparison test). Tether force is shown as mean ± SEM. (n=9-12 cells with a total of 291-800 pulled tethers for each stage). See also Figure S3
Figure 4
Figure 4. Low ratios of polymeric versus monomeric actin in oligodendrocytes
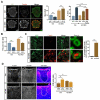
(A) F-to G-actin ratios were quantified in cultured oligodendrocytes after 2, 3 and 5 days in vitro (div). The insoluble F-actin pool was separated from the soluble G-actin pool using Triton-X100 extraction and subsequent centrifugation. The fractions were immunoblotted against actin. HEK293 cells treated with latrunculin A served as a control. Bars show mean ± SD (n=3 experiments, *p < 0.05, **p < 0.01, t-test). (B) Quantification of F- to G- actin fluorescence intensity ratios by staining oligodendrocytes from day 1 to day 5 in vitro with DNaseI to visualize G- and phalloidin-rhodamine to label F-actin (n=20 cells from three experiments, *p<0.05, ***p<0.001, t-test). (C) Sections of P17 mouse brains were stained as above to visualize G- and F-actin levels. Shown is the ratio of F- to G-actin ratio image in pseudocolours to indicate the high intensitiy pixels. Quantification of F- to G-actin fluorescence intensity ratios in the corpus callosum (indicated by white line; white matter) and the region above the corpus callosum (above the white line; grey matter) (n>20 images from different animals, bars show mean ± SD, ***p < 0.001, t-test). Scale bars, 10 μm.
Figure 5
Figure 5. ADF/Cofilin1 activity is required for F-actin disassembly in oligodendrocyte
(A) Oligodendrocytes were cultured from ADF/Cofilin1 KO (AC DKO) and littermate control mice and stained for F-actin using rhodamine-phalloidin and with antibodies against galactosylceramide (O1) to visualize the cell surface (DIV6). Quantification of F-actin fluorescence intensity (mean arbitrary units, AU) and cell surface projection area (n=26-52 cells from three experiments, bars show mean ± SEM, **p < 0.01, ***p < 0.001, t-test). Scale bars, 10 μm. (B) Oligodendrocytes were cultured from controls (ADF KO) and ADF/Cofilin1 KO (AC DKO) mice and F- to G- actin fluorescence intensity ratios were quantified from stainings with DNaseI to visualize G- and phalloidin-rhodamine to label F-actin (n=17-40 cells from three experiments, bars show mean ± SEM, **p < 0.01, ***p < 0.001, t-test). (C) Localization of F-actin and MBP in spinal cord sections (400 nm thick) of control and ADF/Cofilin1 DKO mice at P12. Percentage of myelinated axons showing F-actin labeling within sheaths using rhodamine-phalloidin. Bars show mean ± SEM (n=3, 874-1266 myelinated axons per animal, ***p < 0.001, t-test). Scale bars, 5 μm. (D) Sections of P17 mouse spinal cords from control (ADF KO) and ADF/Cofilin1 DKO (AC DKO) mice were stained to visualize G- and F-actin levels. Shown is also the ratio of F- to G-actin ratio image in pseudocolours to indicate the high intensitiy pixels. Quantification of F- to G-actin fluorescence intensity ratios in the grey (area outside of the white line) and white matter (indicated by a white line) (n>10 images from four animals, bars show mean ± SEM, *p < 0.01, t-test). Scale bars, 10 μm. See also Figures S4 and S5
Figure 6
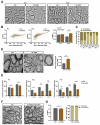
Figure 6. ADF/Cofilin1 is required for myelin growth in mice
(A) Electron micrograph of cervical spinal cord of controls (ADF/+*Cofilinflox/wt *Cnp1-Cre/+) and ADF/Cofilin1 DKO (ADF−/−*Cofilin1flox/flox *Cnp1-Cre/+) mice at P7 and P17. Scale bar= 1 μm. (B) Scatter plots of g-ratios of individual fibers in relation to respective axon diameters quantified from ADF/Cofilin1 KO (AC DKO; brown circles) and littermate controls (Ctrl; dark circles) at P7 and P17. Right panel, average g-ratio values show that myelin thickness continues to increase in the controls but not in the ADF/Cofilin1 DKO (~100 axons from 3-4 mice of each age and genotype were analyzed; ***p < 0.001). (C) Percentage of myelinated and unmyelinated axons, counted at P7, P13 and P17 shows that mutants myelinate less axons from P13 onwards as compared to the control (~1000 axons from >50 EM images of 3-4 mice were counted for each time point). (D) Left panel, ADF/Cofilin1 DKO mice show increased inner tongues (arrows and inset). Right panel, quantification showing larger diameter of the inner tongue (in relation to axonal size) in ADF/Cofilin1 KO at P17 as compared to control. A ratio of 1 corresponds to no inner tongue. (E) Quantification of compacted myelin sheath thickness (in nm) in relation to respective axon diameter at P7, P13 and P17. Since very few axons with a diameter between 0-0.5 μm are myelinated at P7, the data for this time point is not shown. Bars show mean ± SEM (n >100 axons per diameter range of three mice per genotype; *p<0.05, ***p<0.001, t-test) (F) Electron micrographs of control (ADF −/−*Cofilin1fl/fl *PLP-CreERT2/− + Tamoxifen) and after conditional inactivation (ADF −/−*Cofilin1fl/fl *PLP-CreERT2/+ + Tamoxifen) are shown. Tamoxifen was injected at P21 and mice were analyzed 9 weeks later. Scale bar 2 μm (G) G-ratio analysis of control and conditional AC DKO mice are shown as mean ± SEM (~400 axons were quantified of at least three animals per genotype). Right panel, percent of myelinated axons, >300 axons were counted per animals per genotype. See also Figure S6
Figure 7
Figure 7. Model of the role of F-actin in myelin growth
(A) Cartoon showing the structure of a typical growth cone (e.g. in an elongating axon or an OPC). The growth cone is anchored to the extracellular substrate by transmembrane adhesion receptors (pink) to generate a frictional interface for force transmission. (B) Cartoon showing the structure of the leading edge at the inner tongue of the myelin sheath. We propose that the polymerizing forces of F-actin push out membrane protrusions that squeeze in between the axon and the myelin sheath, whereas the subsequent disassembly of F-actin promotes adhesion and spreading. Thus, sustained cycles of actin-based in- and deflation (arrows) may drive extension and spreading of the growing myelin membrane.

Similar articles

Cited by

References

    1. Aggarwal S, Yurlova L, Snaidero N, Reetz C, Frey S, Zimmermann J, Pahler G, Janshoff A, Friedrichs J, Muller DJ, et al. A Size Barrier Limits Protein Diffusion at the Cell Surface to Generate Lipid-Rich Myelin-Membrane Sheets. Dev Cell. 2011;21:445–456. - PubMed
    1. Bauer NG, Richter-Landsberg C, Ffrench-Constant C. Role of the oligodendroglial cytoskeleton in differentiation and myelination. Glia. 2009;57:1691–1705. - PubMed
    1. Bellenchi GC, Gurniak CB, Perlas E, Middei S, Ammassari-Teule M, Witke W. N-cofilin is associated with neuronal migration disorders and cell cycle control in the cerebral cortex. Genes Dev. 2007;21:2347–2357. - PMC - PubMed
    1. Benninger Y, Thurnherr T, Pereira JA, Krause S, Wu X, Chrostek-Grashoff A, Herzog D, Nave KA, Franklin RJ, Meijer D, et al. Essential and distinct roles for cdc42 and rac1 in the regulation of Schwann cell biology during peripheral nervous system development. J Cell Biol. 2007;177:1051–1061. - PMC - PubMed
    1. Bercury KK, Macklin WB. Dynamics and Mechanisms of CNS Myelination. Dev Cell. 2015;32:447–458. - PMC - PubMed

Publication types

MeSH terms

LinkOut - more resources