

Structure-based redesign of lysostaphin yields potent antistaphylococcal enzymes that evade immune cell surveillance
- PMID: 26151066
- PMCID: PMC4470366
- DOI: 10.1038/mtm.2015.21
Structure-based redesign of lysostaphin yields potent antistaphylococcal enzymes that evade immune cell surveillance
Abstract
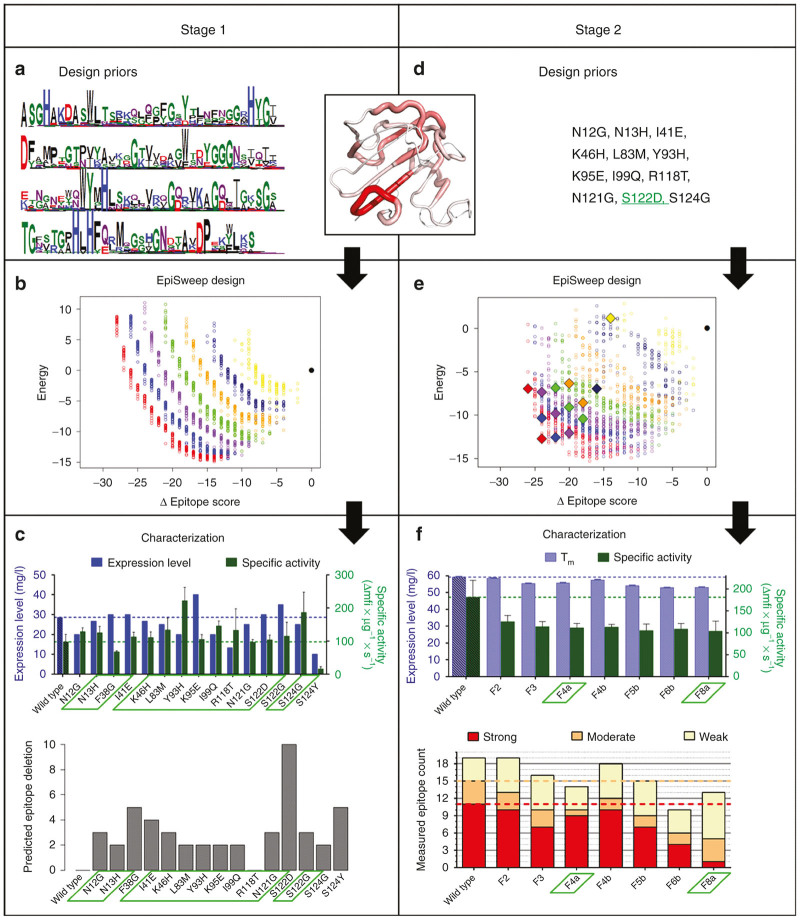
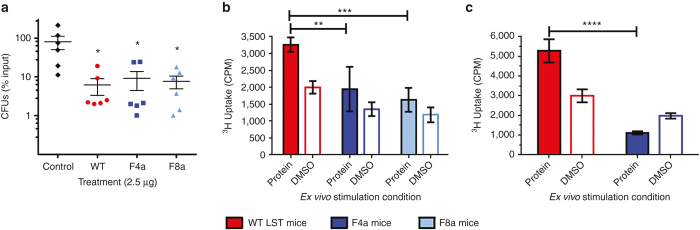
Staphylococcus aureus infections exert a tremendous burden on the health-care system, and the threat of drug-resistant strains continues to grow. The bacteriolytic enzyme lysostaphin is a potent antistaphylococcal agent with proven efficacy against both drug-sensitive and drug-resistant strains; however, the enzyme's own bacterial origins cause undesirable immunogenicity and pose a barrier to clinical translation. Here, we deimmunized lysostaphin using a computationally guided process that optimizes sets of mutations to delete immunogenic T cell epitopes without disrupting protein function. In vitro analyses showed the methods to be both efficient and effective, producing seven different deimmunized designs exhibiting high function and reduced immunogenic potential. Two deimmunized candidates elicited greatly suppressed proliferative responses in splenocytes from humanized mice, while at the same time the variants maintained wild-type efficacy in a staphylococcal pneumonia model. Overall, the deimmunized enzymes represent promising leads in the battle against S. aureus.
Figures

Similar articles
-
Depletion of T cell epitopes in lysostaphin mitigates anti-drug antibody response and enhances antibacterial efficacy in vivo.Chem Biol. 2015 May 21;22(5):629-39. doi: 10.1016/j.chembiol.2015.04.017. Chem Biol. 2015. PMID: 26000749 Free PMC article.
-
Globally deimmunized lysostaphin evades human immune surveillance and enables highly efficacious repeat dosing.Sci Adv. 2020 Sep 2;6(36):eabb9011. doi: 10.1126/sciadv.abb9011. Print 2020 Sep. Sci Adv. 2020. PMID: 32917596 Free PMC article.
-
In vivo efficacy of the antimicrobial peptide ranalexin in combination with the endopeptidase lysostaphin against wound and systemic meticillin-resistant Staphylococcus aureus (MRSA) infections.Int J Antimicrob Agents. 2010 Jun;35(6):559-65. doi: 10.1016/j.ijantimicag.2010.01.016. Epub 2010 Mar 4. Int J Antimicrob Agents. 2010. PMID: 20206480
-
Lysostaphin: an antistaphylococcal agent.Appl Microbiol Biotechnol. 2008 Sep;80(4):555-61. doi: 10.1007/s00253-008-1579-y. Epub 2008 Jul 8. Appl Microbiol Biotechnol. 2008. PMID: 18607587 Review.
-
Lysostaphin: A Staphylococcal Bacteriolysin with Potential Clinical Applications.Pharmaceuticals (Basel). 2010 Apr 19;3(4):1139-1161. doi: 10.3390/ph3041139. Pharmaceuticals (Basel). 2010. PMID: 27713293 Free PMC article. Review.
Cited by
-
Hydrogel delivery of lysostaphin eliminates orthopedic implant infection by Staphylococcus aureus and supports fracture healing.Proc Natl Acad Sci U S A. 2018 May 29;115(22):E4960-E4969. doi: 10.1073/pnas.1801013115. Epub 2018 May 14. Proc Natl Acad Sci U S A. 2018. PMID: 29760099 Free PMC article.
-
T cell epitope engineering: an avian H7N9 influenza vaccine strategy for pandemic preparedness and response.Hum Vaccin Immunother. 2018;14(9):2203-2207. doi: 10.1080/21645515.2018.1495303. Epub 2018 Sep 5. Hum Vaccin Immunother. 2018. PMID: 30015562 Free PMC article. Review.
-
Linker Editing of Pneumococcal Lysin ClyJ Conveys Improved Bactericidal Activity.Antimicrob Agents Chemother. 2020 Jan 27;64(2):e01610-19. doi: 10.1128/AAC.01610-19. Print 2020 Jan 27. Antimicrob Agents Chemother. 2020. PMID: 31767724 Free PMC article.
-
Design and engineering of deimmunized biotherapeutics.Curr Opin Struct Biol. 2016 Aug;39:79-88. doi: 10.1016/j.sbi.2016.06.003. Epub 2016 Jun 17. Curr Opin Struct Biol. 2016. PMID: 27322891 Free PMC article. Review.
-
Electrostatic-Mediated Affinity Tuning of Lysostaphin Accelerates Bacterial Lysis Kinetics and Enhances In Vivo Efficacy.Antimicrob Agents Chemother. 2021 Mar 18;65(4):e02199-20. doi: 10.1128/AAC.02199-20. Print 2021 Mar 18. Antimicrob Agents Chemother. 2021. PMID: 33468459 Free PMC article.
References
-
- Pantosti A, Venditti M. What is MRSA? Eur Respir J. 2009;34:1190–1196. - PubMed
-
- Defres S, Marwick C, Nathwani D. MRSA as a cause of lung infection including airway infection, community-acquired pneumonia and hospital-acquired pneumonia. Eur Respir J. 2009;34:1470–1476. - PubMed
-
- Wisplinghoff H, Bischoff T, Tallent SM, Seifert H, Wenzel RP, Edmond MB. Nosocomial bloodstream infections in US hospitals: analysis of 24,179 cases from a prospective nationwide surveillance study. Clin Infect Dis. 2004;39:309–317. - PubMed
-
- Fowler VG, Jr, Miro JM, Hoen B, Cabell CH, Abrutyn E, Rubinstein E, ICE Investigators Staphylococcus aureus endocarditis: a consequence of medical progress. JAMA. 2005;293:3012–3021. - PubMed
-
- Klein EY, Sun L, Smith DL, Laxminarayan R. The changing epidemiology of methicillin-resistant Staphylococcus aureus in the United States: a national observational study. Am J Epidemiol. 2013;177:666–674. - PubMed
Grants and funding
LinkOut - more resources
Full Text Sources
Other Literature Sources
