

Quantification of biological aging in young adults
- PMID: 26150497
- PMCID: PMC4522793
- DOI: 10.1073/pnas.1506264112
Quantification of biological aging in young adults
Abstract
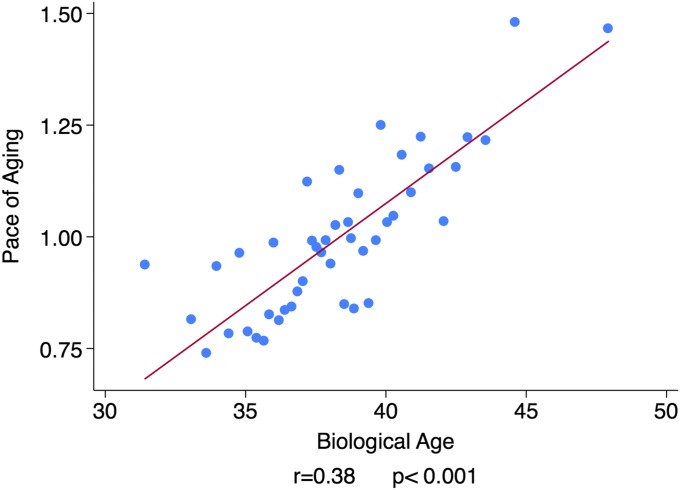
Antiaging therapies show promise in model organism research. Translation to humans is needed to address the challenges of an aging global population. Interventions to slow human aging will need to be applied to still-young individuals. However, most human aging research examines older adults, many with chronic disease. As a result, little is known about aging in young humans. We studied aging in 954 young humans, the Dunedin Study birth cohort, tracking multiple biomarkers across three time points spanning their third and fourth decades of life. We developed and validated two methods by which aging can be measured in young adults, one cross-sectional and one longitudinal. Our longitudinal measure allows quantification of the pace of coordinated physiological deterioration across multiple organ systems (e.g., pulmonary, periodontal, cardiovascular, renal, hepatic, and immune function). We applied these methods to assess biological aging in young humans who had not yet developed age-related diseases. Young individuals of the same chronological age varied in their "biological aging" (declining integrity of multiple organ systems). Already, before midlife, individuals who were aging more rapidly were less physically able, showed cognitive decline and brain aging, self-reported worse health, and looked older. Measured biological aging in young adults can be used to identify causes of aging and evaluate rejuvenation therapies.
Keywords: aging; biological aging; cognitive aging; geroscience; healthspan.
Conflict of interest statement
The authors declare no conflict of interest.
Figures


Comment in
-
Reply to Newman: Quantification of biological aging in young adults is not the same thing as the onset of obesity.Proc Natl Acad Sci U S A. 2015 Dec 29;112(52):E7164-5. doi: 10.1073/pnas.1518878112. Epub 2015 Dec 16. Proc Natl Acad Sci U S A. 2015. PMID: 26676581 Free PMC article. No abstract available.
-
Is the onset of obesity the same as aging?Proc Natl Acad Sci U S A. 2015 Dec 29;112(52):E7163. doi: 10.1073/pnas.1515367112. Epub 2015 Dec 16. Proc Natl Acad Sci U S A. 2015. PMID: 26676582 Free PMC article. No abstract available.
-
Shifting the focus of aging research into earlier decades of life.Oral Dis. 2016 Apr;22(3):166-8. doi: 10.1111/odi.12431. Epub 2016 Jan 20. Oral Dis. 2016. PMID: 26713862 No abstract available.
Similar articles
-
The Longitudinal Study of Aging in Human Young Adults: Knowledge Gaps and Research Agenda.J Gerontol A Biol Sci Med Sci. 2017 Feb;72(2):210-215. doi: 10.1093/gerona/glw191. Epub 2016 Oct 7. J Gerontol A Biol Sci Med Sci. 2017. PMID: 28087676 Free PMC article.
-
Impact of early personal-history characteristics on the Pace of Aging: implications for clinical trials of therapies to slow aging and extend healthspan.Aging Cell. 2017 Aug;16(4):644-651. doi: 10.1111/acel.12591. Epub 2017 Apr 12. Aging Cell. 2017. PMID: 28401731 Free PMC article.
-
Quantification of the pace of biological aging in humans through a blood test, the DunedinPoAm DNA methylation algorithm.Elife. 2020 May 5;9:e54870. doi: 10.7554/eLife.54870. Elife. 2020. PMID: 32367804 Free PMC article.
-
MRI-based biomarkers of accelerated aging and dementia risk in midlife: how close are we?Ageing Res Rev. 2020 Aug;61:101075. doi: 10.1016/j.arr.2020.101075. Epub 2020 Apr 20. Ageing Res Rev. 2020. PMID: 32325150 Review.
-
Cross-sectional and longitudinal associations between adherence to Mediterranean diet with physical performance and cognitive function in older adults: A systematic review and meta-analysis.Ageing Res Rev. 2021 Sep;70:101395. doi: 10.1016/j.arr.2021.101395. Epub 2021 Jun 19. Ageing Res Rev. 2021. PMID: 34153553 Review.
Cited by
-
The Dunedin study after half a century: reflections on the past, and course for the future.J R Soc N Z. 2022 Sep 7;53(4):446-465. doi: 10.1080/03036758.2022.2114508. eCollection 2023. J R Soc N Z. 2022. PMID: 39439967 Free PMC article.
-
The importance of geriatric and surgical co-management of elderly in muscoloskeletal oncology: A literature review.Orthop Rev (Pavia). 2020 Jun 25;12(Suppl 1):8662. doi: 10.4081/or.2020.8662. eCollection 2020 Jun 29. Orthop Rev (Pavia). 2020. PMID: 32913597 Free PMC article.
-
Is an MRI-derived anatomical measure of dementia risk also a measure of brain aging?Geroscience. 2023 Feb;45(1):439-450. doi: 10.1007/s11357-022-00650-z. Epub 2022 Sep 2. Geroscience. 2023. PMID: 36050589 Free PMC article.
-
Socioeconomic Status, Lifestyle, and DNA Methylation Age Among Racially and Ethnically Diverse Adults: NIMHD Social Epigenomics Program.JAMA Netw Open. 2024 Jul 1;7(7):e2421889. doi: 10.1001/jamanetworkopen.2024.21889. JAMA Netw Open. 2024. PMID: 39073814 Free PMC article.
-
Inflammatory markers and bone health in postmenopausal women: a cross-sectional overview.Immun Ageing. 2019 Jul 10;16:15. doi: 10.1186/s12979-019-0155-x. eCollection 2019. Immun Ageing. 2019. PMID: 31333751 Free PMC article.
References
-
- Department of Economic and Social Affairs, Population Division . World Population Ageing 2013. United Nations; New York: 2013.
-
- Harper S. Economic and social implications of aging societies. Science. 2014;346(6209):587–591. - PubMed
-
- Hayflick L. The future of ageing. Nature. 2000;408(6809):267–269. - PubMed
Publication types
MeSH terms
Substances
Grants and funding
- G9806489/MRC_/Medical Research Council/United Kingdom
- G0601483/MRC_/Medical Research Council/United Kingdom
- T32 AG000139/AG/NIA NIH HHS/United States
- MR/K00381X/1/MRC_/Medical Research Council/United Kingdom
- P30 AG028716/AG/NIA NIH HHS/United States
- T32 AG000029/AG/NIA NIH HHS/United States
- R01 AG032282/AG/NIA NIH HHS/United States
- AG032282/AG/NIA NIH HHS/United States
- AG048895/AG/NIA NIH HHS/United States
- P30 AG028716-08/AG/NIA NIH HHS/United States
- P30 AG034424/AG/NIA NIH HHS/United States
- R01 AG048895/AG/NIA NIH HHS/United States
- G0100527/MRC_/Medical Research Council/United Kingdom
- MR/K00381X/MRC_/Medical Research Council/United Kingdom
LinkOut - more resources
Full Text Sources
Other Literature Sources
Medical
Research Materials
