Review
. 2015 Jun 17:3:85.
doi: 10.3389/fbioe.2015.00085. eCollection 2015.

Retroactivity in the Context of Modularly Structured Biomolecular Systems

Affiliations
Review

Retroactivity in the Context of Modularly Structured Biomolecular Systems

Libertad Pantoja-Hernández et al. Front Bioeng Biotechnol. .

Abstract

Synthetic biology has intensively promoted the technical implementation of modular strategies in the fabrication of biological devices. Modules are considered as networks of reactions. The behavior displayed by biomolecular systems results from the information processes carried out by the interconnection of the involved modules. However, in natural systems, module wiring is not a free-of-charge process; as a consequence of interconnection, a reactive phenomenon called retroactivity emerges. This phenomenon is characterized by signals that propagate from downstream modules (the modules that receive the incoming signals upon interconnection) to upstream ones (the modules that send the signals upon interconnection). Such retroactivity signals, depending of their strength, may change and sometimes even disrupt the behavior of modular biomolecular systems. Thus, analysis of retroactivity effects in natural biological and biosynthetic systems is crucial to achieve a deeper understanding of how this interconnection between functionally characterized modules takes place and how it impacts the overall behavior of the involved cell. By discussing the modules interconnection in natural and synthetic biomolecular systems, we propose that such systems should be considered as quasi-modular.

Keywords: modularity; regulatory biomolecular networks; retroactivity; signal transduction; synthetic biology; systems biology.


Figures

Figure 1
Figure 1
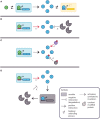
Modules and retroactivity. (A) A biomolecular module, A (whose given function is to produce a finite set of n molecules given an input signal, i.e., a stimulus). (B) The output of A is connected to the input channel of a second module, B. This connection will decrease the signal output of module A by m molecules that are degraded, sequestered or transformed by B. In the black square we include the options of degradation, covalent modification and simple sequestration by binding. If module B significantly changes the original signal coming from module A (i.e., imposing a load in its input channel), the functionality of this upstream module may be changed or even disrupted.
Figure 2
Figure 2
Galling hypothesis. A few hypothesis about how galls take place and maintain in plants have been posed. This image intends to summarize most of them according to the exposed in Hearn (2014) and Tooker and Helms (2014). (A) Regarding hormones, two likely ways have been proposed to induce and maintain a gall. In the first one, the wasp larva could be sequestering hormones as in the left case (in red) or produce hormones-like metabolites that trick plant’s network as in the right case. (B) There are multiple factors in both wasp (blue font) and plants (green font) that could be involved in the induction and/or preservation of galls without the need to interfere directly with the hormones. Here we show some of such hypotetical factors in two phases of gall development: induction and growth. Changes in the plant cells and structures are indicated with arrows.
Figure 3
Figure 3
Regulation of Th (T helper) cells (in green) by retroactivity. Th cells produce IL-2 (yellow tangerine diamonds), which is sensed by receptors on their own cell surface (in bright yellow), resulting in proliferation. Th cell would be equitable to module A in Figure 1 and IL-2 to its output, which in this particular example is also its own input. If there is not enough IL-2, the cells become anergic and rapidly die. T regulatory cells (Treg, in blue) also have IL-2 receptors. This makes Treg cells capable of sequestering IL-2 and then analogous to the B module in Figure 1. The retroactivity and loads effects become significant as T regulatory cells have more receptors than Th cells, which enables them to regulate by competition with the Th population.
Figure 4
Figure 4
Network representation: (A) classical representation of a non-directed network where nodes (a, b, c) are the elements of interest, and the edges represent interaction between elements. (B) Example of a directed network. In directed networks, the order (from source to destiny) is evident. Sometimes, positive relations (activations) are depicted by arrows, and negative ones (repression) are depicted by truncated lines. It is also possible to find directed networks in which all relations are represented by arrows.
Figure 5
Figure 5
Retroactivity in a box. (A) Symbolic representation of the isolated input–output system as in Del Vecchio et al. (2008) and as an input–output system where retroactivity is neglected. S denotes the system, e is the system’s internal state, z is the input signal received by the module S, and x is the output signal emitted by S (which in this case coincides with the internal state of the system, i.e., e). Arrows indicate the signal direction as in Figure 2 (the functionality of S in isolation consists of processing signal z to get signal x). This figure is equitable to Figure 1A. Here, z would be the input and x the output. (B) Representation of the different signals that may be involved with S as a result of the interconnection; signals r and s correspond to retroactivity to the input and output, respectively. (C) Representation of the embedded system explicitly showing the upstream and downstream modules as well as the interconnection signals (d and f denote the internal state of system Si and system S0, respectively). Here, relative to S0, S would be analogous to A in Figure 1, and S0 would be equitable to B in Figure 1B.
Figure 6
Figure 6
Retroactivity changes the system’s behavior (focus on retroactivity to the output). (A) Isolated input–output module (based on Figure 1A). This is a cartoon representation of the system, with the processes involved in the module output in blue arrows and with v1 denoting the rate of production of x (output signal) due to the presence of a transcription factor z. v2 denotes the degradation of x. Here, the module in blue would be equivalent to A in Figure 1. (B) Cartoon representation of the connected system, with the involved processes in the module output denoted by blue arrows and connection processes represented by red arrows as a set of binding/unbinding events (with v3 and v4 the association and dissociation rates, respectively). Here, v3 denotes the loss in x species, which changes the upstream’s output concentration and thus its behavior. As mentioned in the main text, the retroactivity, and thus its potential to change behavior, depends on the number of downstream modules and the rates of association and dissociation. Here, the blue module would be equivalent to module A in Figure 1B and the yellow one would be analogous to the B one in Figure 1B. v3 and v4 play the role of x and s, respectively, in Figure 4C. The schematic representations are based on those used in Del Vecchio et al. and Sauro et al. Further details of how each of this systems aid retroactivity insulation are given in the main text.
Figure 7
Figure 7
Dynamic insulation schemes based on both gain amplification-degradation and time-scale separation. K and G are the degradation and amplification reactions, respectively. (A) Basic system without insulation. A transcription factor (TF), represented by z, activates the system [partially omitted in (B–D)]. The small arrows represent binding and unbinding interactions of TFs. The modules are delimited by a square with a dashed perimeter. Downstream to the module and regulated by the module’s output is the module C. The retroactivity to the output of the first module, the one producing x, depends on the association and dissociation rates as well as in the amount of binding sites present in module C. Other parameters, as the TF–DNA complex degradation rate also influences the retroactivity value and its effects under the upstream module. The big arrow denotes the output production. The downstream module (in yellow and denoted by C) is obviated in the next items for simplicity. As in Figure 5, the blue module can be considered analogous to module A and the yellow one is equitable to B. (B) Gain amplification- degradation. Amplification is attained by using a strong and non-leaky binding site (in red). Degradation is achieved by a protease (y). (C) Time-scale insulation by covalent modification of the TF of interest. Amplification is given by a protein (h) capable of transducing the covalent signal that activates the TF (x). Degradation is caused by another protein (y), which removes the modification. (D) Alternative feedback dependent degradation scheme. x promotes the transcription of a degradation agent y.

Similar articles

Cited by

References

    1. Alexander R. P., Philip M. K., Emonet T., Gerstein M. B. (2009). Understanding modularity in molecular networks requires dynamics. Sci. Signal. 2, e44.10.1126/scisignal.281pe44 - DOI - PMC - PubMed
    1. Alon U. (2003). Biological networks: the tinkerer as an engineer. Science 301, 1866–1867.10.1126/science.1089072 - DOI - PubMed
    1. Alon U. (2007). An Introduction to Systems Biology: Design Principles of Biological Circuits. Boca Raton, FL: CRC Press.
    1. Álvarez Buylla E. R., Chaos A., Aldana M., Benítez M., Cortes-Poza Y., Espinosa-Soto C., et al. (2008). Floral morphogenesis: stochastic explorations of a gene network epigenetic landscape. PLoS ONE 3:e3626.10.1371/journal.pone.0003626 - DOI - PMC - PubMed
    1. Andrec M., Kholodenko B. N., Levy R. M., Sontag E. D. (2005). Inference of signaling and gene regulatory networks by steady-state perturbation experiments: structure and accuracy. J. Theor. Biol. 232, 427–441.10.1016/j.jtbi.2004.08.022 - DOI - PubMed

LinkOut - more resources