Review
. 2015 Oct;25(10):1073-188.
doi: 10.1002/hipo.22488.

Hippocampal sharp wave-ripple: A cognitive biomarker for episodic memory and planning

Affiliations
Review

Hippocampal sharp wave-ripple: A cognitive biomarker for episodic memory and planning

György Buzsáki. Hippocampus. 2015 Oct.

Abstract

Sharp wave ripples (SPW-Rs) represent the most synchronous population pattern in the mammalian brain. Their excitatory output affects a wide area of the cortex and several subcortical nuclei. SPW-Rs occur during "off-line" states of the brain, associated with consummatory behaviors and non-REM sleep, and are influenced by numerous neurotransmitters and neuromodulators. They arise from the excitatory recurrent system of the CA3 region and the SPW-induced excitation brings about a fast network oscillation (ripple) in CA1. The spike content of SPW-Rs is temporally and spatially coordinated by a consortium of interneurons to replay fragments of waking neuronal sequences in a compressed format. SPW-Rs assist in transferring this compressed hippocampal representation to distributed circuits to support memory consolidation; selective disruption of SPW-Rs interferes with memory. Recently acquired and pre-existing information are combined during SPW-R replay to influence decisions, plan actions and, potentially, allow for creative thoughts. In addition to the widely studied contribution to memory, SPW-Rs may also affect endocrine function via activation of hypothalamic circuits. Alteration of the physiological mechanisms supporting SPW-Rs leads to their pathological conversion, "p-ripples," which are a marker of epileptogenic tissue and can be observed in rodent models of schizophrenia and Alzheimer's Disease. Mechanisms for SPW-R genesis and function are discussed in this review.

Keywords: epilepsy; imagining; learning; memory; planning.


Figures

Figure 1
Figure 1
Behavior‐dependence of hippocampal LFP activity. Top, LFP recorded from symmetric locations of the left (LH) and right (RH) dorsal CA1 str. radiatum during locomotion—immobility transition. Note regular theta waves during locomotion and large amplitude, bilaterally synchronous negative waves (sharp waves, SPW) during immobility. Below, SPWs recorded from str. radiatum (red) and ripple recorded from the CA1 pyramidal layer. Reproduced from Buzsáki et al. (1992).
Figure 2
Figure 2
Preservation of SPW‐Rs in mammals. Illustrative traces of ripples recorded from various species. Reproduced from Buzsáki et al., (2013).
Figure 3
Figure 3
SPWs and ripples in the CA1 region during sleep and stillness on the maze. (A) Raw traces of wide‐band LFP (1–625 Hz) recorded simultaneously from the CA1 pyramidal layer and the mid str. radiatum, together with a band‐pass filtered (50–250 Hz) trace of the pyramidal layer signal. An isolated single and a cluster of SPW‐Rs (burst) are shown. (B) Top, time‐frequency spectrogram (whitened; log scale) of several hours of recording on the same day from the CA1 region in the home cage (left and right) and maze (middle sessions). Gray lines, gaps in recordings. Note increased theta and gamma power during maze sessions. Bottom, SPW‐R events as a function of time/behavior. Each asterisk is a single SPW‐R event. r, REM sleep episodes of sleep. SWS‐HC, events detected during slow wave (non‐REM) sleep in the home cage; S‐HC, events detected during quiet wakefulness in the home cage; REM‐HC, events detected during REM sleep in the home cage; S‐M, events detected during immobility, drinking in the maze; R‐M, events detected during runs in the maze. (C) Incidence of SPW‐Rs during different behaviors. Same code as in (B). (D) Examples of true SPW‐Rs during REM‐HC (left), and false SPW‐R events during R‐M (right). The bottom REM‐HC panel shows a true SPW, embedded in a stream of theta waves. The rat's trajectory for the whole R‐M session in shown gray; the rat's position during the R‐M spurious SPW‐R is shown in red (Sullivan and Buzsáki, unpublished data).
Figure 4
Figure 4
Properties of SPW‐Rs during sleep and waking are different. (A) Average wavelet spectrograms of SPW‐R‐centered epochs from the CA1 pyramidal layer recorded during slow wave (non‐REM) sleep in the home cage (SWS‐HC), quiet wakefulness in the home cage (S‐HC), and immobility, drinking in the maze (S‐M). (B) Average power spectrum of SPW‐Rs during SWS‐HC, S‐HC, and S‐M (mean ± SEM; n = 9 rats). (C) Average histogram of the peak spectral frequency (calculated via FFT) of SPW‐R events in different brain states. Modal frequency of SPW‐Rs during SWS‐HC: 167 Hz, S‐HC: 177 Hz and S‐M: 187 Hz (P < 0.00001; Kruskal‐Wallis test). (D) Relationship between SPW amplitude and peak ripple frequency (mean ± SEM; n = 9 rats). Note ripple frequency at 200 Hz during maximum SPW amplitude during SWS‐HC and S‐HC but not S‐M (Sullivan and Buzsáki, unpublished data).
Figure 5
Figure 5
SPW‐Rs embedded in a stream of theta waves. Two‐second epoch of activity during REM sleep recorded with a linear silicon probe, covering the CA1‐CA3‐axis. LFP traces (16 sites) are superimposed on the CSD map. Two SPW‐Rs were detected (asterisks). Note that in both cases, ripples in the CA1 pyramidal layer are coupled with a large SPW in str. radiatum (white arrows) and a large source in the CA3 pyramidal layer. P, CA1 pyramidal layer,; r, str. radiatum; lm, str. lacunosum‐moleculare; m, dentate molecular layer; g, granule cell layer; CA3p, hilus, pyramidal layer of CA3c subregion (Sullivan and Buzsáki, unpublished data).
Figure 6
Figure 6
CA3 afferents drive SPWs. (A) Regional distribution of SPW currents. CSD maps (1 Hz to 10 kHz) in two different animals with the average SPW waveforms superimposed (gray traces). Note strong SPWs (sinks) in the stratum radiatum of CA1 and CA3 and the inner molecular layer of the dentate gyrus. Sinks in the inner molecular layer of the dentate gyrus possibly reflect activation of excitatory inputs from hilar mossy cells. Eight‐shank × 16 recording/site per shank probes were used to record LFP simultaneously. (B) Depth versus amplitude profiles of SPWs (filled circles) derived from a movable microelectrode (solid line) and a stationary electrode in CA1 pyramidal layer (dashed line). Each point is an average of 30 SPWs recorded concurrently with the two electrodes. Horizontal bars indicate standard error of the mean. Also shown is the depth versus amplitude profile of the simultaneously recorded field potential in response to stimulation of the Schaffer collaterals (inset, empty circles). Ordinate: 166 µm intervals. Peak amplitude of SPW (asterisk) occurs in the mid stratum radiatum. p, pyramidal layer; r, stratum radiatum, m, molecular layer; g, granule cell layer. A, reproduced after Sullivan et al. (2011). B, reproduced from Buzsáki et al. (1983).
Figure 7
Figure 7
Skewed distribution of the magnitude of population synchrony during ripples and other brain states. (A) Wide‐band and ripple band (140–230 Hz) filtered LFP (top) and spiking activity of simultaneously recorded 75 CA1 pyramidal cells. Two ripple events with relatively low (0.09) and high (0.16) fractions of neurons firing synchronously during ripples. (B) Distribution of the synchrony of CA1 pyramidal cells’ firing during ripples of sleep and in 100 ms time windows during non‐REM (slow wave sleep, SWS) and exploration (RUN). (C) Correlation between firing rates of single CA1 pyramidal cells during ambulation in a maze (RUN) and SPW‐Rs of sleep. Note that high firing rate of neurons in the waking brain are more constant participants in SPW‐Rs than slow firing neurons. A and B are reproduced from Mizuseki and Buzsáki (2013).
Figure 8
Figure 8
Complete reconstruction of the axon arbor of an in vivo recorded and filled CA3b pyramidal cell. (A) Coronal view of the entire axon arbor (black lines). Red triangle shows the location of the cell body. Dentate granule cell layer is marked with blue lines, CA1‐3 pyramidal cell layer is marked with light blue lines. D: dorsal, V: ventral, L: lateral, M: medial, A: anterior, P: posterior. (B) This rotated view shows that CA3 pyramidal cell axon collaterals follow the curve of the cornu Ammonis. (C) View of the axon arbor from dorsal direction. (D) View from medial direction. Reproduced from Wittner et al. (2007).
Figure 9
Figure 9
SPW‐Rs are terminated by hyperpolarization. (A) Top: cartoon of a microdrive and scheme of the electrode arrangement in the dorsal CA1 pyramidal layer for intracellular recording in freely moving mice. Bottom: intracellular filled and labeled pyramidal cell. (B) LFP trace (blue) showing two SPW‐R events (asterisks) and simultaneously recorded membrane potential (V m, red). (C) Correlation between V m ripple power (100–200 Hz) and postripple V m as a function of time; red is mean; light red lines are SEM. (D) LFP ripple‐triggered average of post‐ripple V m. Ripples with spikes: mean (red) and SEM (light red); ripples with no spikes: mean (dark green) and SEM (green); (E) LFP ripple‐triggered average of LFP and V m at rest (64 mV) and during two levels of negative current injection (resulting in 79 mV, 117 mV). (F) SPW‐R peak‐triggered average LFP, using three different thresholds (<3 SD, 3–5 SD and >5 SD of background power in the 100–200 Hz band). (G) Multiple unit firing during the corresponding three averages. Note ramp‐like elevation of multiple unit discharge preceding the SPW‐R and the decreased (below baseline) activity after the SPW‐R. For these analyses only isolated SPW‐Rs were selected. (H) Correlation between ripple current power (CSD) and the magnitude of post‐ripple negativity (“AHP”) in the CA1 pyramidal layer. Note that larger amplitude ripples are followed by larger post‐ripple negativity (as in F). A–E are reproduced from English et al. (2014). F–H are unpublished findings by Sullivan and Buzsáki.
Figure 10
Figure 10
(A) Spontaneous SPW‐Rs recorded from transverse ventral hippocampal slices. A. Typical field recording of SWR events from the CA1 pyramidal cell layer. The original trace (top) and the band‐pass filtered sweep disclosing the ripple oscillation (bottom) are shown. Three episodes of clustered SPW‐Rs containing two to three events are presented. (B) The histogram of probabilities of occurrence of SPW‐R clusters containing one or more events (gray bars). (C) Wide‐band recorded SPW‐R in the CA1 pyramidal cell layer. (D) Wide‐band recorded SPW‐R induced by repeated high frequency stimulation in area CA3. (E) SPW‐R in CA1; (A, B), reproduced from Papatheodoropoulos and Koniaris (2011); (C) reproduced from Maier et al. (2003); (D) Reproduced from Bukalo et al. (2013); (E) Reproduced from Behrens et al. (2011). Note highly variable in vitro ripple patterns from various laboratories.
Figure 11
Figure 11
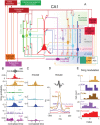
SPW‐R‐related firing patterns of interneurons. (A) Schematic of the main synaptic connections of pyramidal cells (red, middle), three types of CCK‐expressing cells (basket cell, perforant path‐associated cell, Schaffer collateral‐associated cell), ivy cells and PV‐expressing basket, axo‐axonic, bistratified and O‐LM interneurons. Connections among interneurons are not shown. (B) Firing probability histograms; averages from several cells of the same type recorded in anaesthetized rats. Note different scales for the y‐axis. (C) Firing probability histograms for non‐anesthetized mice. In B and C all neurons were labeled juxtacellularly and identified histologically. (D) Firing patterns of optogenetically identified PV‐expressing and SOM‐expressing interneurons during SPW‐Rs. Also shown are putative, physiologically characterized interneurons. Note that almost all PV and PV‐like neurons were robustly active during ripples, whereas the firing behavior of SOM, non‐bursting and pyramidal cells was variable. (E) Distribution of ripple modulation index in the five cell groups. The bimodal behavior of SOM neurons may represent a mixture of O‐LM (ripple‐activated) and bistratified (ripple suppressed) interneurons. Modulation index: the mean firing rate between −150 and −50 ms is subtracted from the mean rate between −50 and 50 ms and normalized. Positive (negative) indexes indicate an increase (suppression) of firing during SPW‐Rs. A and B, reproduced from Somogyi et al., (2014). C, Reproduced from Varga et al. (2012). D, E, reproduced from Royer et al. (2012).
Figure 12
Figure 12
Neuronal correlates of SPW‐R in the human hippocampus. (A) Single SPW‐R (black trace), its filtered version (red trace) and time–frequency representation (top). The expanded trace (bottom panel) shows spikes (triangles) during the oscillations, mostly occurring around the negative peak of ripple cycle. (B) Temporal relationship between the maximal neuronal discharge (red, interneurons; blue, pyramidal cells) and the highest peak of the ripple power. (C) Cumulative histogram of preferred firing phase for pyramidal cells (blue) and interneurons (red). Reproduced from Le van Quyen et al. (2008).
Figure 13
Figure 13
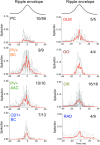
Spike distribution histograms of CA3 neurons during SPW‐Rs in vitro. (A) Spike distribution histograms shown for individual neurons (gray) and their average (red) relative to the peak of the SPW‐R envelop. Numbers in the top‐right indicate the number of neurons that discharged during SPW‐Rs from all recorded and anatomically identified neurons. Note that all interneurons increase their discharge rates during SPW‐R. Reproduced after Hájos et al. (2013).
Figure 14
Figure 14
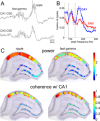
Qualitatively similar and quantitatively distinct features of ripple and fast gamma oscillations. (A) Simultaneously recorded current source density (CSD) traces from CA1 and CA3 pyramidal layers. (B) Normalized power distribution of ripples (measured at 175 Hz) and fast gamma oscillations (110 Hz) in the CA1 and CA3 cell body layers (n = 10 rats). (C) Regional distributions of power within the cell body layers (top) and phase coherence (bottom) with the most medial CA1 pyramidal layer site as the reference. The size and color of circles indicate the magnitude of power and coherence. From Sullivan et al. (2011).
Figure 15
Figure 15
Ripples occur along the entire septotemporal axis of CA1. (A) Diagram indicating the locations of the recording electrodes in the septal and temporal segments of the hippocampus. SH, Septal hippocampus; IH, intermediate hippocampus; TH, temporal hippocampus. (B) LFP traces recorded from the three sites shown in A. (C) Ripple trough‐triggered LFP (100–250 Hz bandpass) and correlated multiple unit activity detected on each electrode (same color code as in A). Middle and right columns show averaged LFP and MUA, but the ripple event times were taken from the most septal reference site (1; reference). The two time scales emphasize ripple wave (middle) and ripple event (right) relationships. Note absence of ripple wave coherence between the septal and temporal segments. (D and E) Examples of single ripple events and their wavelet maps recorded from 10 sites in the septal and intermediate CA1 segments (as in D). Ripple events can spread in a septotemporal or temporoseptal direction (long dashed arrows), but multiple other forms, such as synchronous, or locally confined events are also present. After Patel et al. (2013).
Figure 16
Figure 16
Medial septum stimulation suppresses hippocampal SPW‐Rs. (A) Hippocampal LFP in the CA1 pyramidal layer and stratum radiatum displaying SPW‐R (arrows) before the onset of optogenetic stimulation. (Inset) Expanded time scale of a detected ripple. (B) Left‐most panel: YFP‐positive immunostaining in a coronal section of the MS in a ChATChR2‐YFP hybrid transgenic mouse. LS, lateral septum; VDB, ventral diagonal band. (Scale bar: 200 μm.) Right panels: higher magnification of the MS (rectangle in left panel), double immunostaining of YFP (green, left), and ChAT (red, middle), showing their colocalization. (Scale bar: 10 μm.) (C) Perievent time histogram of SPW‐R occurrence, before, during, and after 10 s sine stimulations. Reproduced from Vandecasteele et al. (2014).
Figure 17
Figure 17
Influence of entorhinal input on CA1 SPW‐R. A. Short epochs of wide‐band CSD traces (raw, 1 Hz to 5 kHz) and their filtered derivatives recorded simultaneously from the CA1 pyramidal layer (CA1 PYR), outer molecular layer (DG OML), and granule cell layer (DG GCL) of the dentate gyrus. The horizontal bar indicates a DOWN state. B. Relationship between DOWN‐UP transition of population firing in the entorhinal cortex (EC, top) and the occurrence of hippocampal SPW‐R (bottom). Reproduced after Isomura et al. (2006).
Figure 18
Figure 18
Hippocampal‐neocortical cross‐frequency interactions during sleep. (A) Hippocampal SPW‐Rs can induce prefrontal delta wave and sleep spindle. Both spindles and ripples then travel from their source location. (B) Traces of neocortical layer V and hippocampal CA1 (filtered between 140 and 240 Hz and rectified) LFP in the rat. (Inset) Filtered ripple at a faster time scale. Dots: peak of delta wave, troughs of sleep spindle and hippocampal ripple waves. (C) Hippocampal ripple peak‐triggered neocortical spectrogram. Power spectrograms, centered on ripples (time 0 s), were averaged and normalized by the mean power over the entire recording session and log transformed. Note increased correlation of power in the slow oscillation (delta; 0.5–4 Hz) and sleep spindle (10–18 Hz) bands with hippocampal ripples. *Slow (0.1 Hz) comodulation of neocortical and hippocampal activity. Reproduced from Sirota et al. (2003).
Figure 19
Figure 19
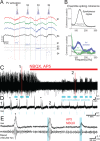
Self‐organized burst of activity in the CA3 region produces a SPW sink (negative wave) in the apical dendrites of CA1 pyramidal neurons and also discharge interneurons. The interactions between the discharging pyramidal cells and interneurons give rise to a short‐lived fast oscillation (“ripple”; 140–200 Hz), which can be detected as a fast LFP oscillation in the CA1 pyramidal layer. The CA1 population burst, in turn, brings about synchronized activity in the target populations of parahippocampal structures as well (Sub, subiculum; Para, parasubiculum; EC, entrorhinal cortex. These parahippocampal ripples are slower and less synchronous, compared with CA1 ripples. Reprinted from Buzsáki and Chrobak (2005).
Figure 20
Figure 20
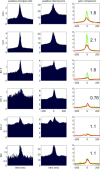
Gain and loss of excitation in different hippocampal‐entorhinal regions during SPW‐Rs. Population means of ripple‐unit cross‐correlograms in CA1, CA3 and dentate gyrus (DG) of the hippocampus and layers II, III, and V of the entorhinal cortex (EC2, EC3, EC5). Principal cells and putative interneurons are shown in the left and middle columns, respectively. Peak of the ripple episode is time 0. Right column, Relative increase of neuronal discharge, normalized to baseline (−200 to 200 ms) for both pyramidal cells (pyr, green line) and interneurons (int, red line). The ratio between the relative peaks of pyramidal cells and interneurons is defined as “gain.” Note largest excitatory gain in CA1, flowed by CA3 and EC5. Gain is balanced in DG and EC2, whereas in EC3 inhibition dominates. Data from Mizuseki et al. (2009).
Figure 21
Figure 21
SPW‐R‐triggered multi‐structure BOLD activity. (A) Time–frequency representation of the SPW‐R events in the macaque monkey under anesthesia. (B) Average activation maps. Positive BOLD response is observed in the neocortex and limbic cortex, while activity suppression of BOLD signal is seen in the diencephalon, mesencephalon and metencephalon. (C) Time courses of each group each region of interest (ROI). Note the sign change in the transition from cortical to subcortical areas and the differences in response onset. (D) Fractions of activated voxels for each region of interest. The blanket reduction of the BOLD signal in subcortical structures, however, do not mean suppression of spiking activity (see text). Reproduced from Logothetis (2015).
Figure 22
Figure 22
Network models of ripple oscillations. (A) Axonal net. The axons of pyramidal neurons (PYRs) are assumed to be connected via electrical synapses (gap junctions). Upon external input during a CA3‐generated SPW (black), orthodromic spikes generated by one PYR also propagate antidromically to synchronize with other PYR; the rhythm frequency may be determined by the sparseness of the gap junctions. (B) Mixed model of pyramidal cells and interneurons. (C) Pacing by feedback inhibition. Both pyramidal cells and interneurons receive external input, and the rhythm is dictated by the time constants of synaptic interaction between the two populations. (D) PYR‐INT‐INT model. Pyramidal cells receive tonic external input that activates both pyramidal cells and the reciprocally connected inhibitory network. Reciprocal inhibition paces the excited pyramidal cells, which in turn generate an LFP ripple. After Stark et al. (2014).
Figure 23
Figure 23
Local activation of pyramidal cells induces ripples. (A) Schematic of diode‐probe shanks overlaid on histological image. (B) Spontaneous ripple (top trace) and optogenetically induced ripple (PYR activation) recorded by the same electrode in a mouse. Stimulus waveform is in blue. Right: time‐frequency decomposition of the ripple event. (C) Left: induced LFP traces during individual pulses (50 ms) of increasing intensity. Right: time‐frequency decomposition. Weak light only induces spiking, whereas ripple oscillations of increasing amplitude and frequency are induced with stronger light. After Stark et al. (2014).
Figure 24
Figure 24
Prolongation and truncation of ripples. (A–E) Perievent histograms of ensemble spiking activity of interneurons (INT, blue) and pyramidal neurons (PYR, red; mean ± SEM) during spontaneous SPW‐Rs (A) and optogenenetic closed‐loop stimulation (C–E). (B) Ripples are detected in real‐time about three cycles after onset, and the detection triggers light stimulation. (C) Ripple‐contingent activation of pyramidal cells drives PYR and increases duration of spontaneously occurring ripples. Example wide‐band trace shows a single event. (D) Direct silencing of pyramidal cells shortens spontaneously occurring ripples. (E) Indirect silencing of pyramidal cells via PV interneuron activation shortens ripples. After Stark et al. (2014).
Figure 25
Figure 25
Lack of neuronal connexins does not noticeably affect SPW‐Rs. (A) Average LFP ripples from Cx36 knockout (n = 3) and Cx36‐Cx45 double knockout (n = 4) mice. (B) Distribution of inter‐SPW‐R intervals. (C) Distribution of peak frequency of ripples (n = ∼10,500 ripples in Cx36 and 12,000 in Cx36‐Cx45 mice) (Vandecasteele M, Menzies, AS, Creese, I, Paul DL, Buzsaki G. 2008. Persistence of hippocampal oscillations in connexin 36, 45 double knock‐out mice. Society for Neuroscience Abstracts. 435.4/H9).
Figure 26
Figure 26
Action potential properties in and outside of SPW‐Rs. (A) Left, Example waveforms of average action potential during ripples (green) and nonripple periods (blue) from one neuron. Right, Expanded view of the spike pair at left to illustrate the difference in threshold. SPW‐R periods are defined from the times at the peaks of the SPW‐Rs detected in the LFP. Shaded area is SEM. (B) Phase plane plot of average action potential waveforms. Each color is one neuron; solid lines are outside of ripples; dashed lines are during ripples. (C) Expanded view of section phase plane plot with spike amplitude normalized across neurons to illustrate the shape near threshold. After English et al. (2014).
Figure 27
Figure 27
Tonically driven PV interneurons induce coherent spiking at ripple frequency and can pace ensemble spiking. (A) Optogenetic activation of PV interneurons in a behaving PV::ChR2 mouse. Wide‐band traces recorded at 200 µm intervals during sequential illumination (square pulses) of the CA1 pyramidal layer. Vertical colored lines delimit illumination on each shank, and horizontal dashed lines separate units recorded on distinct shanks (S1 to S4). Red/blue ticks indicate pyramidal and interneuron spike times, respectively. Each row corresponds to a single unit. Note locally induced interneuron spiking but no visible LFP ripples. (B) Ensemble spiking coherence. Coherence between aggregated pyramidal neurons recorded on different shanks. Cross‐shank spiking coherence was computed between agglomerated spike trains during spontaneous ripples (top, black trace), during PV activation (bottom, blue) or PV silencing (C, green). Note increased and decreased spike coherence during PV activation and inactivation, respectively. (C) Induced ripples by optogenetic driving of PV interneurons in vitro during blockade of ionotropic excitatory synaptic transmission (NBQX and AP5). Blue bars, light stimulation periods. (D) Zoomed traces from C. Asterisks, spontaneous ripples. A–B, reprinted with permission from Stark et al. (2014). D–E, reprinted with permission from Schlingloff et al. (2014).
Figure 28
Figure 28
Independent ripple oscillators become coherent by simultaneous activation. (A) Simultaneous multi‐site illumination generates phase‐coherent ripples at higher amplitude (and lower frequency) as compared with sequential, single‐site illumination. Spectrograms show time‐frequency decomposition of the CA1 pyramidal layer LFP traces. Calibration bars: 20 ms. Right: auto‐correlation (same site) and cross‐correlation (distant‐sites: separation >400 μm) of LFP traces. (B) Fraction of phase‐modulated neurons during single site (S1–S6) or simultaneous multiple site (multi‐site) optogenetic stimulation of pyramidal cells (red) and putative interneurons (blue). Note long‐distance entrainment of interneurons but not pyramidal cells. After Stark et al. (2014).
Figure 29
Figure 29
SPW‐Rs in early development. (A) Three different type of CA1 pyramidal cells are encountered at birth: cells that are synaptically silent, cells with only GABAergic synaptic activity and cells with both GABAergic and glutamatergic synaptic activity. (B) Simultaneous recordings of a CA3 pyramidal cell and extracellular multiple unit burst in CA3 pyramidal cell layer in postnatal day 6 hippocampal slice during GDP. (C) Intracellular correlates of SPWs (GDP) in vivo. Intracellular (CA1 pyramidal cell, whole‐cell) and extracellular (stratum radiatum, SR) recordings during a SPW event in a postnatal day 5 pup. Upper pair: intracellular voltage clamp at glutamate reversal potential (0 mV), showing presumed GABAA receptor‐mediated postsynaptic currents (upward deflections). Lower pair: intracellular voltage clamp at GABAA reversal potential (−73 mV), showing presumed glutamate receptor‐mediated postsynaptic currents (downward deflections). (D) Developmental changes of hippocampal network events and single neuron properties. Already at the embryonic stage, immature pyramidal neurons have a large tonic GABAergic conductance. GABAergic synapses are functional before glutamatergic ones, but GDPs/SPWs are first seen only after the establishment of functional glutamatergic synapses. CA3 pyramidal neurons generate intrinsic burst activity throughout postnatal development. In vitro, the probability of GDP occurrence decreases as the GABAA‐receptor mediate action shifts from depolarizing to hyperpolarizing. In vivo, SPWs are the first endogenous event of activity seen during ontogeny but ripple oscillation emerge at an older age. The approximate developmental time scale shows the late embryonic period (E) and the postnatal period from P0 (postnatal day 0; time of birth) to P20 in rats. A and B, reproduced from Ben‐Ari (2001), C, reproduced from Leinegukel et al. (2002), D, reproduced from Sipilä and Kaila (2007).
Figure 30
Figure 30
Model of SPW‐Rs built from skewed statistics of firing rates, bursts and synaptic weights. (A) Proportion of spikes during highly synchronous events, the proportion of highly synchronous events in which the neuron fires two or more events, and the mean number of spikes per highly synchronous events. Note lognormal distributions. (B) The proportion of pyramidal neurons that fire at least once during a “SPW‐R” synchronous event is distributed lognormally. (C) Correlation between firing rate and proportion of synchronous events in which the neuron fired (left) and between firing rate and mean number of spikes per “SPW‐R” synchronous events. Reproduced from Omura et al. (2015).
Figure 31
Figure 31
Synchronous spikes from distant neurons can contribute substantially to LFP ripple oscillations. (A) The locations of neurons that spike during ripple periods are indicated by triangles in a top‐down view of the pyramidal layer (left), with colors indicating the 50‐µm wide rings from which the spikes originate. Voltage, Ve, traces are colored correspondingly, with contributions from each ring of cells adding cumulatively from the outside in. Stacked histograms above the potential traces show spike times. Averaged power spectra of the stratum pyramidale Ve from each individual ring. The insets indicate the proportions of the total Ve power at 150 Hz generated by each ring‐ or disk‐shaped subpopulation (i.e., the peak values of the power spectra, normalized by the power at 150 Hz in the full population). Reproduced after Schomburg et al. (2012).
Figure 32
Figure 32
Fast oscillations supported by chemical synapses in a model. (A–C) Ripple frequency oscillations in a strongly driven network with pyramidal cells and interneurons, but without pyramid‐to‐pyramid connections (such as CA1). (A) Pyramidal population rastergram and (B) interneuron population rastergram. Right: strongly skewed distribution of firing rates. (C) Instantaneous population firing rate of pyramidal cells (red) and interneurons. (E–H) Same network as in the left but with slow time constants, added recurrent excitatory connections between pyramidal cells and weaker external noise drive (mimicking the CA3 region). Note slow gamma oscillation frequency in the power spectrum. Reproduced from Brunel and Wang (2003).
Figure 33
Figure 33
The CA fields of the hippocampus form a random graph. (A) The dentate gyrus (green)—as input region of the hippocampus—gives local parallel connections to the CA3 region. The CA3 region (blue) forms a strongly connected recurrent axonal graph, in addition to forwarding the information to the CA1 region. The output CA1 region (red) also shows mainly local parallel connections. (B) Multisynaptic, reverberatory path in the entorhinal‐hippocampal system. Segregation and intergration can be iteratively performed by the largely unidirectionally connected layers with alternating parallel and recurrent organization.
Figure 34
Figure 34
SPW‐mimicking bursts induce long‐term plasticity. A: diagram of a hippocampal slice showing the location of the stimulating electrode (S), the recording electrodes (R), and the bicuculline‐containing pipette (BICU). The hatched area shows the typical extent of bicuculline/methylene blue diffusion. B: averages of 8 evoked responses in the pyramidal layer of CA 1 before (above) and 20 min after (below) transient (5 min) bicuculline application to the CA 3 region. Note enhancement of the evoked response after the washout of the drug. C: antidromic responses in CA 3 before (above) and during (below) bicuculline application near the recording electrode in CA3 pyramidal layer. Reproduced from Buzsáki et al. (1987d).
Figure 35
Figure 35
Closed‐loop enhancement of the incidence of SPW‐Rs. (A) Experimental arrangement. LFP recording from CA1 pyramidal cell layer and SPW‐R‐contingent stimulation of the lateral hypothalamus. (B) Representative traces of cell‐attached unit recording and LFP recording. A ripple event is magnified in the inset. (C) Time course of the percent change in the probability of occurrence of SPW‐Rs during 25 min of conditioning. Reproduced from Ishikawa et al. (2014).
Figure 36
Figure 36
Input‐specific events of spontaneous population events in the hippocampus. Recording electrodes (1–4) were placed in the CA1 pyramidal layer along the septotemporal axis of rats in which the fimbria‐fornix was previously removed. Interelectrode distance: 0.5 mm. (A) Single pulse stimulation of the perforant path (PP; arrow) evoked monosynaptic population spike in the dentate gyrus (DG; visible as a volume‐conducted negative spike in CA1; triangle) and multiple population spikes in CA1. (B) Following tetanic stimulation of the perforant path input, spontaneous LFP events (“exaggerated SPWs”) emerged. Two spontaneous events are shown. Note striking similarity between the spatially distinct evoked and spontaneous events and the absence of the dentate component in the spontaneous events. Top right in A, Hypothesis: tetanic stimulation induces synaptic strengthening among a subset of activated CA3 pyramidal neurons (triangles, top). Bottom, during spontaneous events, the same neurons that were activated during stimulation become the initiators and participants of the spontaneous events. Reproduced after Buzsáki (1989).
Figure 37
Figure 37
Memory consolidation and increased incidence of SPW‐Rs in humans. (A) Averaged SPW‐Rs recorded in the rhinal cortex in a representative patient. (B) Correlation between the number of SPW‐Rs during rest/sleep period in the rhinal cortex after leaning and memory performance tested after sleep. Reproduced from Axmacher et al. (2008).
Figure 38
Figure 38
First compelling demonstration of experience‐dependent replay of hippocampal activity. Diagram of the co‐activation matrix of 42 neurons (dots around the perimeter of the circle) recorded from as single rat. Lines indicate a small subset of all positive correlation (>0.2) between the pairs, with color reflecting the magnitude of the correlation (red, high; green, low). Bold lines indicate cell pairs that were correlated during waking activity (RUN) and also correlated during either PRE‐RUN or POST‐RUN sleep. Note that most of the highly correlated pairs that are present during RUN are also present in the POST phase but less frequently during PRE phase. Reproduced from Wilson and McNaughton (1994).
Figure 39
Figure 39
Replay of waking neuronal spike sequences during sleep in hippocampus. Smoothed place fields (colored lines) of eight place cells during runs from left to right on a track (average of 30 trials). Vertical bars mark the positions of the normalized peaks of the smoothed fields. Nonuniform time axis below shows time within an average lap when above positions were passed. Bottom panels: three SPW‐R‐related sequences from slow‐wave sleep after the waking session. Note similar sequences during SPW‐Rs and run. Note also difference in timescale. The scale bar represents 50 ms. Reproduced from Lee and Wilson (2002).
Figure 40
Figure 40
Relationship between SPW‐R parameters and memory performance. (A) Representative example of an animal's path (gray lines) in a cheeseboard task where food is hidden at three locations (black dots). (B) Color‐coded maps illustrating the post‐probe spatial distribution of CA1 place fields in the drug‐free and the CPP‐treated conditions. In the drug‐free condition a higher proportion of cells was associated with goal locations (white arrows). (C) SPW‐R firing rate histograms of CA1 “goal‐centric” and “start‐box” cells inside (In) and outside (Out) their place fields. Note higher firing rates at the tail of the SPW‐R histogram when the rat was sitting within the place field of that neuron. (D) Scatter plot shows post‐probe memory performance (number of crossings near the food locations) as a function of “eSPW‐R synchrony” (percentage of CA1 pyramidal cells that fired during exploratory SPW‐R) after learning. Reproduced from Dupret et al. (2010).
Figure 41
Figure 41
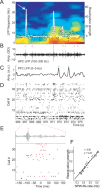
Cell assemblies in the medial prefrontal cortex (mPFC) are reactivated by hippocampal SWP‐Rs during sleep. (A) Reactivation strength (white traces, right axis) of the signal component superimposed on the mPFC LFP spectrogram (left axis). The black dashed line represents the normalized population firing rate. (B) The bandpass‐filtered hippocampal LFP (100–300 Hz) shows ripple events (red asterisks). (C) Bandpassfiltered (0–5 Hz) PFC LFP. Delta waves are denoted by green asterisks. (D) Raster plot of spike trains from the mPFC cells sorted by principal component weight magnitude. (E) Expansion of the 300 ms surrounding the peak indicated by an arrow in A. Red rasters represent spikes occurring in the bin of peak reactivation strength. (F) Relationship of reactivation strength and SPW‐R occurrence. Reproduced from Peyrache et al. (2009).
Figure 42
Figure 42
A hypothetical place‐field model proposed to account for forward and reversed SPW‐R sequences. Place‐related inputs for three neurons are indicated in color. Spiking threshold is shown with a dashed line. On the track, this threshold is theta‐modulated. On the reward platforms, during immobility, a transient decrease in the threshold during SPW‐Rs causes cells to fire outside of their classical place‐fields. Due to hypothetical subthreshold place fields, sequence of firing is forward (1, 2, 3) before and reverse (3, 2, 1) after a rightward journey. The top panel illustrates the transient rise in global excitation (and inhibition), deduced from population spiking activity during immobility ripples (Csicsvari et al., 1999a). Similar models (place field ‘tail’ hypothesis) have been put forward by Buzsáki (1989), Foster and Wilson (2006), and O'Neill et al. (2006). Reproduced from Diba and Buzsaki (2008).
Figure 43
Figure 43
Place cell sequences experienced during behavior are replayed in both the forward and reverse direction during awake SPW‐Rs. Spike trains for place fields of 13 CA3 pyramidal cells on the track are shown before, during and after a single traversal. Sequences that occur during track running are reactivated during SPW‐Rs both before and after the run, when the rat stays immobile. Forward replay (left inset, red box) occurs before traversal of the environment and reverse replay (right inset, blue box) after. The CA1 local field potential is shown on top and the animal's velocity is shown below. Reprinted from Diba and Buzsáki (2007).
Figure 44
Figure 44
Disruption of SWP‐Rs affects memory performance. (A) Training and recording protocol. Rats were allowed to perform three trials each day with the same three arms baited once per trial with chocolate cereal (left, red dots). After the third trial the rat was allowed to rest/sleep in the flowerpot for one hour during which stimulations were triggered, either during (test rats, middle) or outside SPW‐R (stimulation control rats, right). (B) Test rats were significantly impaired in the radial maze task compared with control rats. Grey shading indicates the chance zone. Although performance increased in all groups, rats with ripple suppression took more days to perform above upper chance level and their performance remained consistently below that of the control groups. (C) SPW‐R disruption in waking rats causes a specific impairment in the spatial working memory component in a W‐track task. Proportion correct versus day number for outbound trials is shown. Horizontal dotted line represents chance‐level performance of 0.5. Control rats received stimulation irrespective of SPW‐R occurrence. A and B, Reproduced after Girardeau et al. (2009): C, Reproduced after Jadhav et al. (2012).
Figure 45
Figure 45
Forward and reverse extended replay. (A) Joint reconstruction of position and running direction (500 ms bins). Color indicates estimated running direction (color mapping on the right). Direction is correctly estimated for both the A/B (6750–6770 s) and B/A directions (6,820–6,850 s). (B–F) Examples of forward (FWD), reverse (REV), and mixed (MIX) replay from a representative rat, each labeled with its replay order score. Joint position and direction estimates (20 ms bins). Black triangles indicates animal's position and facing direction. Asterisks indicate start and end of detected replay trajectory. (Middle) Multiunit activity. (Bottom) Extent of a replay event. B. Forward replay in the A/B direction proceeding ahead of the animal. (C) Forward replay in the B/A direction, starting 2 m behind the animal and proceeding behind the animal. (D) Reverse replay, starting remotely and proceeding toward the animal. Trajectory is similar to (C), but this is a reverse‐ordered replay because the estimated running direction (i.e., A/B [blue]) does not agree with the direction in which the replay proceeds (i.e., from B/A). E. Top view of the 10.3 m long track. Reproduced from Davidson et al. (2009).
Figure 46
Figure 46
Construction of novel shortcuts by SPW‐Rs. Examples of trajectories never directly experienced by the rat. In the bottom panels, spikes are plotted by ordered place field center for both left and right loops over the same 0.5 s period. The gray vertical lines mark the beginning and end of the shortcut sequence and capture the exact same period of time on both left and right loop raster plots (as can also be seen in the repeated LFP trace). Diamond, position of the rat during SPW‐R replay. Color coding represents the trajectory of the animal. Spikes plotted on the 2D maze (top panels) to visualize the shortcut trajectories spanning the top of the maze. Note that the “shotcut” replays are not smooth but are potentially composed of an initial reverse replay of one segment followed by a forward replay of another segment of the maze (arrows). Reproduced from Gupta et al. (2010).
Figure 47
Figure 47
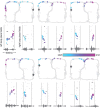
Joint replay directionality. (A) The junction of the three arms (C, central; R, right; L, left) is the choice point. Running toward the choice point is “inbound” (In) and running away is “outbound” (Out). (B–E) Examples of joint replay sequences with different combinations of directionalities from a representative rat. Horizontal dashed lines indicate arm boundaries. Black diamond shapes mark the location of the rat when each replay occurred. The color scale is set so that maximally saturated colors correspond to the highest position probability of each replay. (B) A consistent reverse replay of CR. Below (E), raw LFP recording from one selected tetrode channel. Note the presence of double ripple, each corresponding to the replay of one arm segment (C and R). Reproduced from Wu and Foster (2014).
Figure 48
Figure 48
Prelay of neuronal spike sequences. (A) Examples of forward preplay of a future novel place cell sequence using template matching method. (B) Sequential firing of place cells on the novel track (C) Comparison between firing rates during exploration of a novel maze (RUN) and SWS in the home cage either before or after the maze session. (A, B) reproduced after Dragoi and Tonegawa (2011). (C), reproduced from Mizuseki and Buzsáki (2013).
Figure 49
Figure 49
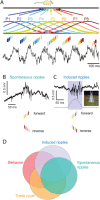
Temporal correlation of spike sequences at multiple time scales. (A) Gaussians indicate idealized, smoothed sequences of place fields of CA1 place cells P1 to P8 on the track. Ticks within theta cycles represent spikes. The width of the bars indicates firing intensity. Theta timescale temporal differences related to their respective distance representations. While the rat moves left to right, place fields (P1 to P8) shift together in time and sustain a temporal order relationship with each other so that the place cell that fires on the earliest phase represents a place field whose center the animal traverses first. By this temporal compression mechanism distances are translated into time. Reproduced from Dragoi and Buzsáki (2006). (B) During immobility periods at the beginning or the end of the track, place cell sequences are also replayed during SPW‐Rs in a forward or reverse manner, respectively. (C) Optogenetically induced ripples also generate organized firing sequences whose temporal order correlates with the order of firing during both SPW‐Rs and theta waves. Reproduced from Stark et al. (2015). (D) Venn diagram indicating partial correlations across various conditions. Part of the correlations may emerge by local mechanisms while other parts can be inherited from upstream (e.g., CA3) regions. Figure courtesy of Lisa Roux.
Figure 50
Figure 50
SPWs and interictal epileptic discharges (IEDs). (A) Neuronal synchrony along the longitudinal axis of the CA1 pyramidal layer during a sharp‐wave burst (SPW) in an intact animal. (B) Hippocampus disconnected from its subcortical connections (fimbria‐fornix lesion). Placement of electrodes 1–7. (C) Type 1 IEDs in lesioned rats (middle and bottom). Note tighter synchrony of population bursts and larger amplitude of the field responses during IEDs. Note different amplitude calibration in the intact and lesioned rats. Arrows, prolonged, post‐IED activity of two putative interneurons. (D) Type 1 IED. Note reverberation of activity in the entorhinal cortex‐hippocampus‐entorhinal cortex and amplification of neuronal activity. Top trace, the dentate molecular layer (DG mol). Note entorhinal input‐induced responses (asterisks). Bottom trace, CA1 pyramidal layer trace. Reverberation in was terminated by the appearance of a large population spike. Reproduced from Buzsáki et al. (1991).
Figure 51
Figure 51
P‐ripples in epileptic patients. (A) Coexistence of ripples and p‐ripples in human entorhinal cortex and hippocampus of an epileptic patient. Note bilateral occurrence of the ripple but unilateral confinement of the p‐ripple (arrows). (B) Another p‐ripple (arrow) in the left medial hippocampus accompanied by high frequency unit discharges. Unfiltered data are shown in the top. The bottom trace is high‐pass filtered (200 Hz). Diamonds mark action potentials. LEC, REC: left and right entorhinal cortex. LmHip, RmHip: left and right medial hippocampus. Reproduced from Bragin et al., 1999. (C) P‐ripples (high frequency oscillations, HFO) are able to identify the seizure zone (in red). Correlation between removal of HFO‐generation tissue removal and post‐surgical seizure outcome indicate the epileptogenic area (blue dashed lines). Whether HFOs outside the epileptogenic zone are present and contribute to neuropsychological deficit (green areas) needs to be investigated further. Reproduced from Jacobs et al. (2012).
Figure 52
Figure 52
Conversion of SPW‐Rs to p‐ripples may be separated by an asynchronous transition epoch. (A) Time‐binned autocorrelogram of multi‐unit activity showing that the synchrony of firing during SPW‐Rs, transition period and preictal p‐ripples (24 min sweep). Epileptiform event was induced by high K+ in vitro. (B) Abolishing SPW‐Rs in vivo by local infusion of picrotoxin (PTX) and induction of p‐ripples. Note long transition period of no‐SPW‐Rs at 50s. Both SPW‐Rs and fast p‐ripples were induced by focal light stimulation of CA1 pyramidal cells in a CaMKII::ChR2 mouse. Panels show the time‐frequency decomposition of the pyramidal layer CSD traces. (C) LFP traces at different depths across the CA1 pyramidal layer at 50 µm steps (grey lines) and current source density (color maps) of average SPW‐Rs (100 ms sweep) and PTX‐induced p‐ripples (50 ms sweep). (A) Reproduced from Karlocai et al., 2014; (B, C) Reproduced from Stark et al., 2014.
Figure 53
Figure 53
Altered SPW‐Rs in (Alzheimer's Disease model) rTg4510 mice. (A) Example SPW‐R detected from wild type (left) and rTg4510 (right) mice. The detected ripples are highlighted on the wide band (WB) trace. The band‐pass (100–250 Hz) filtered signal is shown below. Scale bars: WT, 200 μV, 30 ms; rTg4510, 100 μV, 30 ms. (B) Mean normalized short‐time Fourier analyses of SPW‐Rs in wild type and rTg4510 mice. The graph above the spectrogram shows the total power with respect to time, whilst the graph to the right shows the total power with respect to frequency. Reproduced from Witton et al. (2014).

Similar articles

Cited by

References

    1. Abeles M, Bergman H, Margalit E, Vaadia E. 1993. Spatiotemporal firing patterns in the frontal cortex of behaving monkeys. J Neurophysiol 70:1629–1638. - PubMed
    1. Abraham WC, Gustafsson B, Wigstrom H. 1986. Single high strength afferent volleys can produce long‐term potentiation in the hippocampus in vitro. Neurosci Lett 70:217–222. - PubMed
    1. Adey WR, Kado RT, Rhodes JM. 1963. Sleep: Cortical and subcortical recordings in the chimpanzee. Science 141:932–933. - PubMed
    1. Agarwal G, Stevenson IH, Berenyi A, Mizuseki K, Buzsáki G, Sommer FT. 2014. Spatially distributed local fields in the hippocampus encode rat position. Science 344:626–630. - PMC - PubMed
    1. Aivar P, Valero M, Bellistri E, Menendez de la Prida L. 2014. Extracellular calcium controls the expression of two different forms of ripple‐like hippocampal oscillations. J Neurosci 34:2989–3004. - PMC - PubMed

Publication types