. 2015 Jul 2;11(7):e1005367.
doi: 10.1371/journal.pgen.1005367. eCollection 2015 Jul.

SAMHD1 Inhibits LINE-1 Retrotransposition by Promoting Stress Granule Formation

Affiliations

SAMHD1 Inhibits LINE-1 Retrotransposition by Promoting Stress Granule Formation

Siqi Hu et al. PLoS Genet. .

Abstract

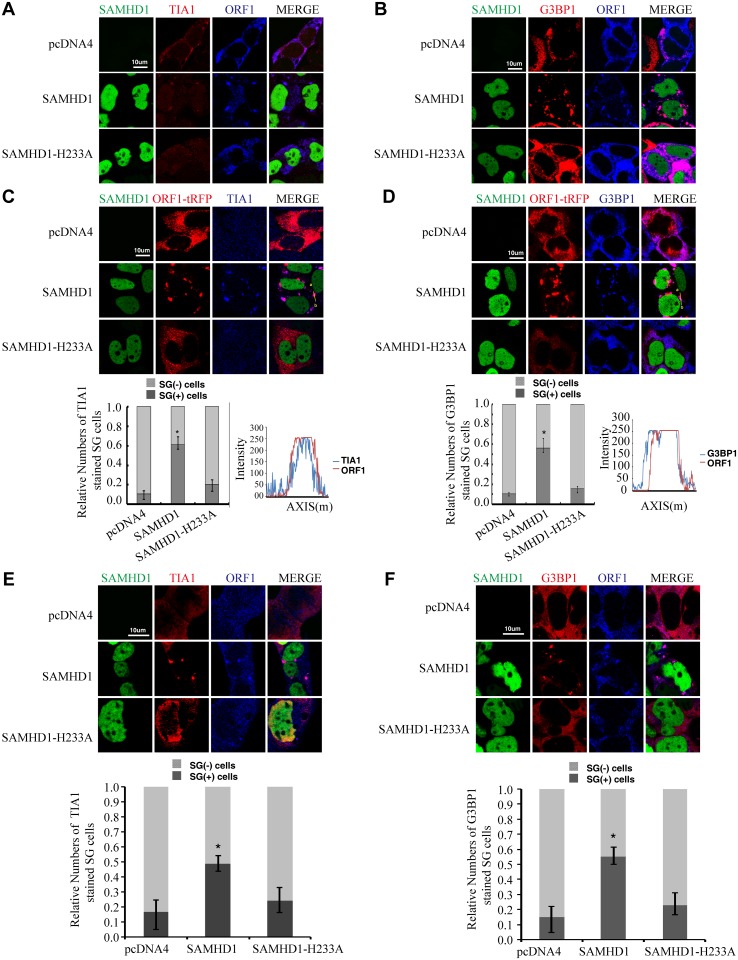
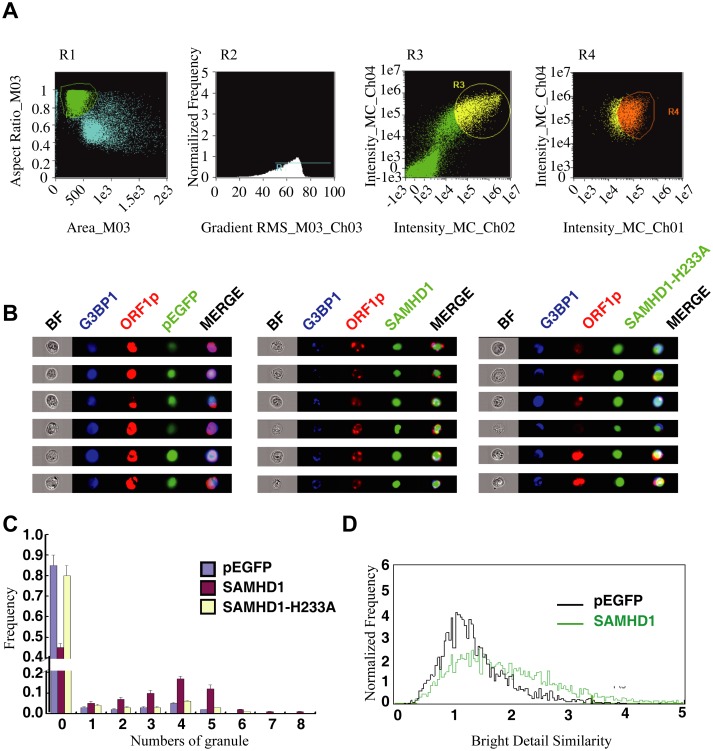
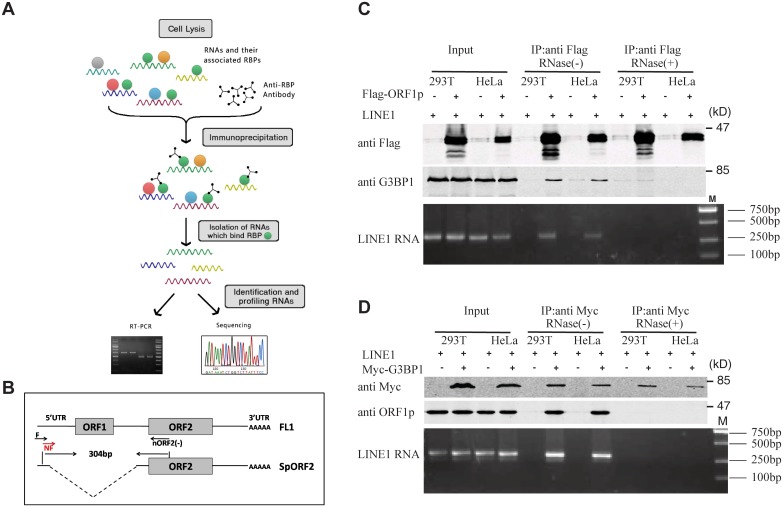
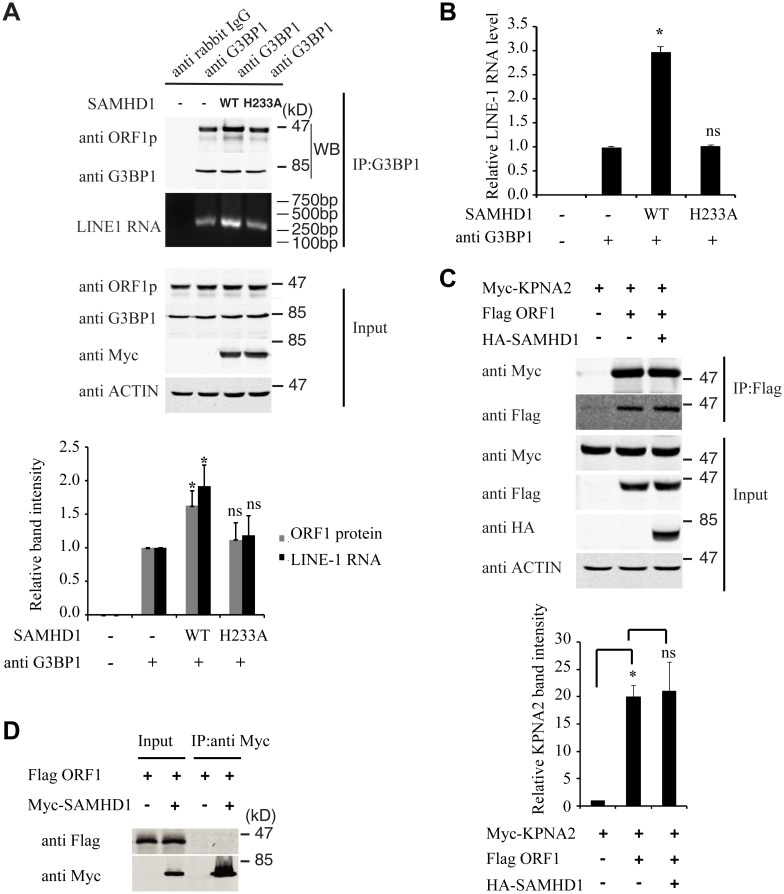
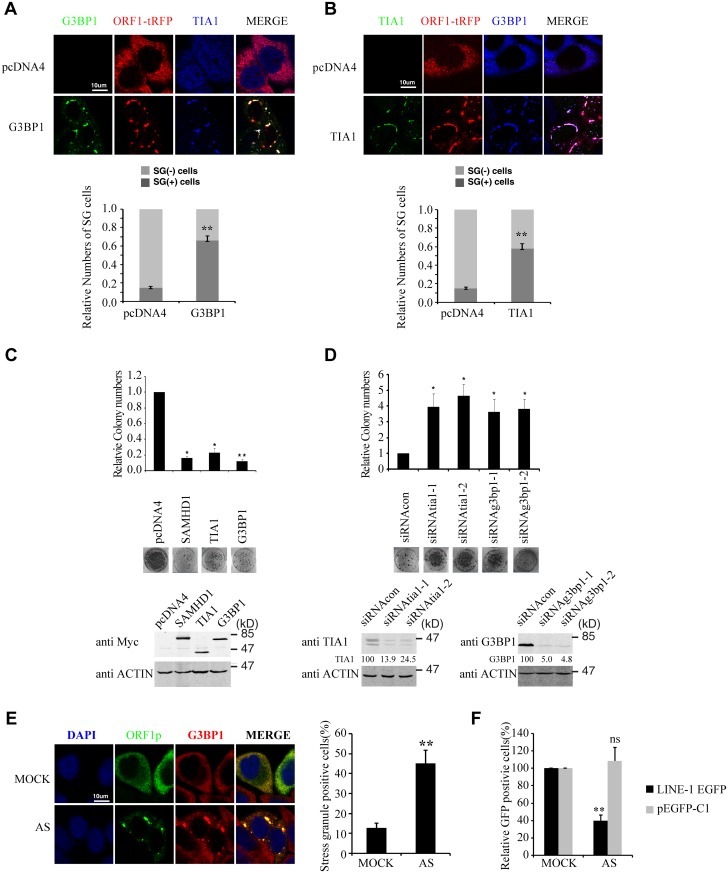
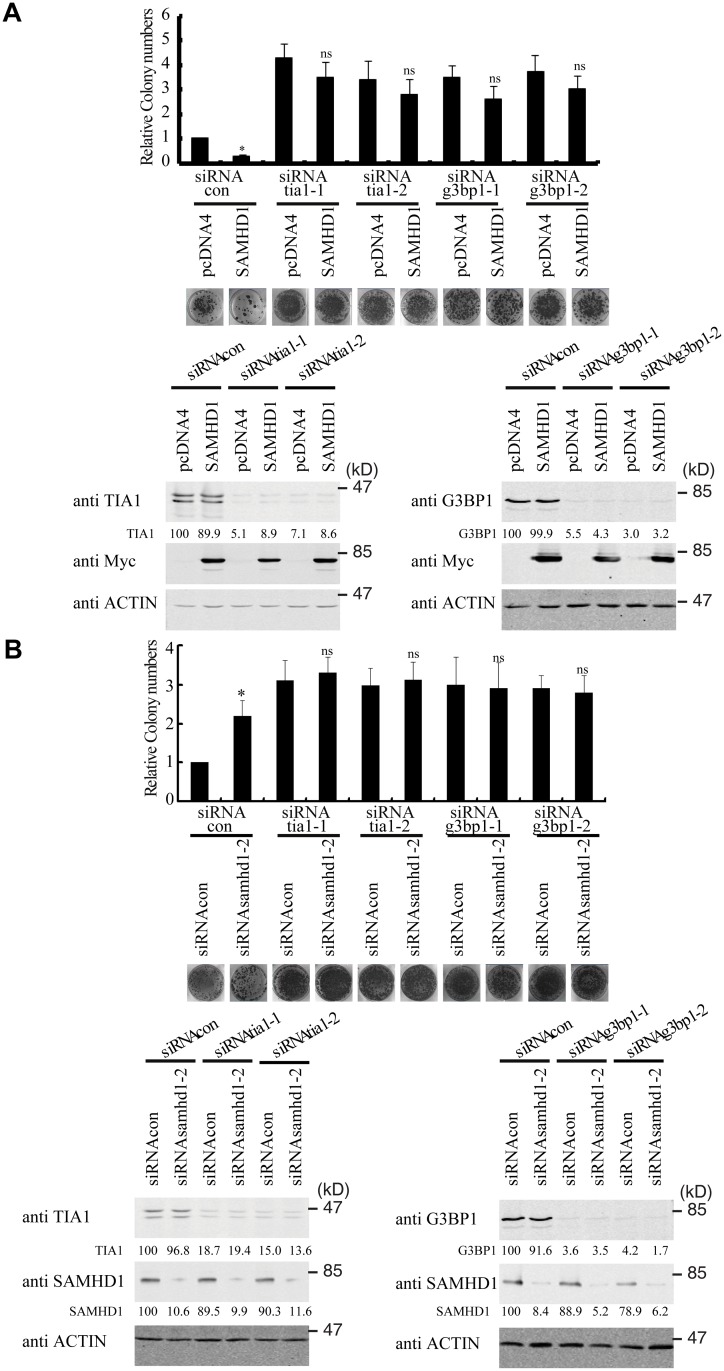
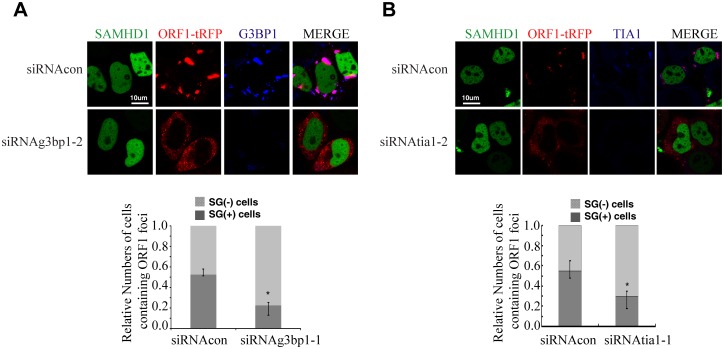
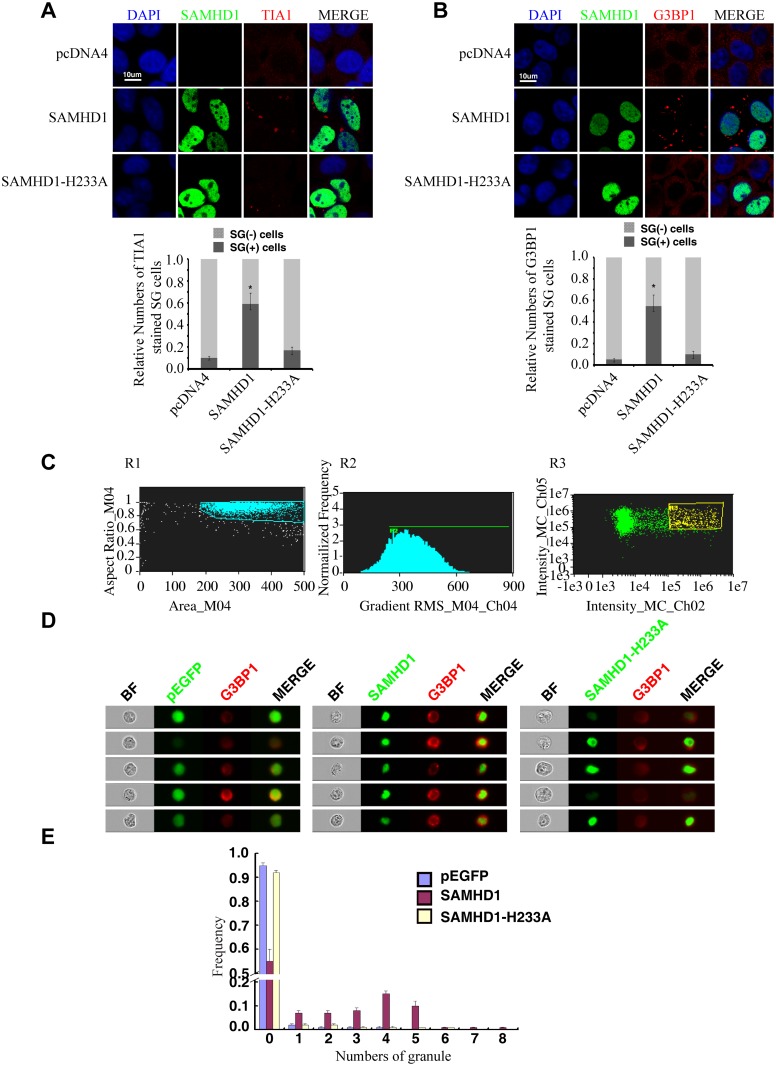
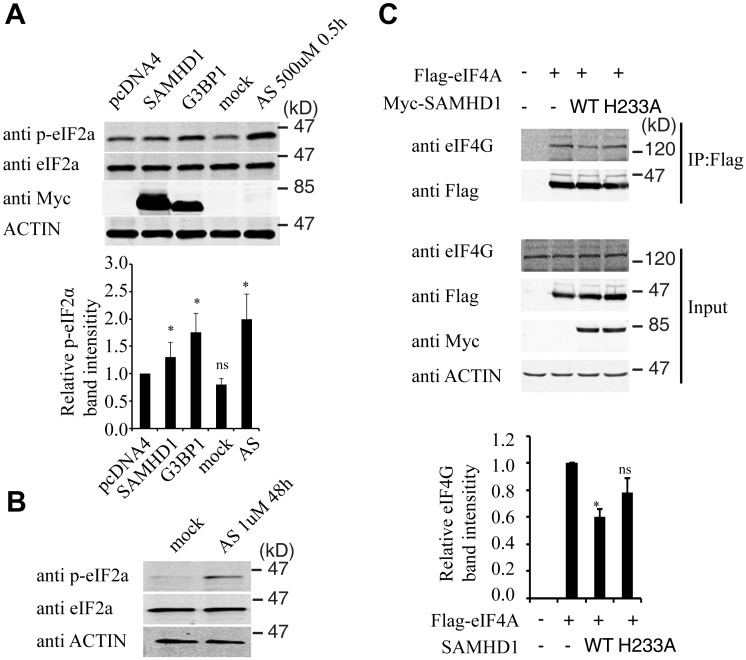
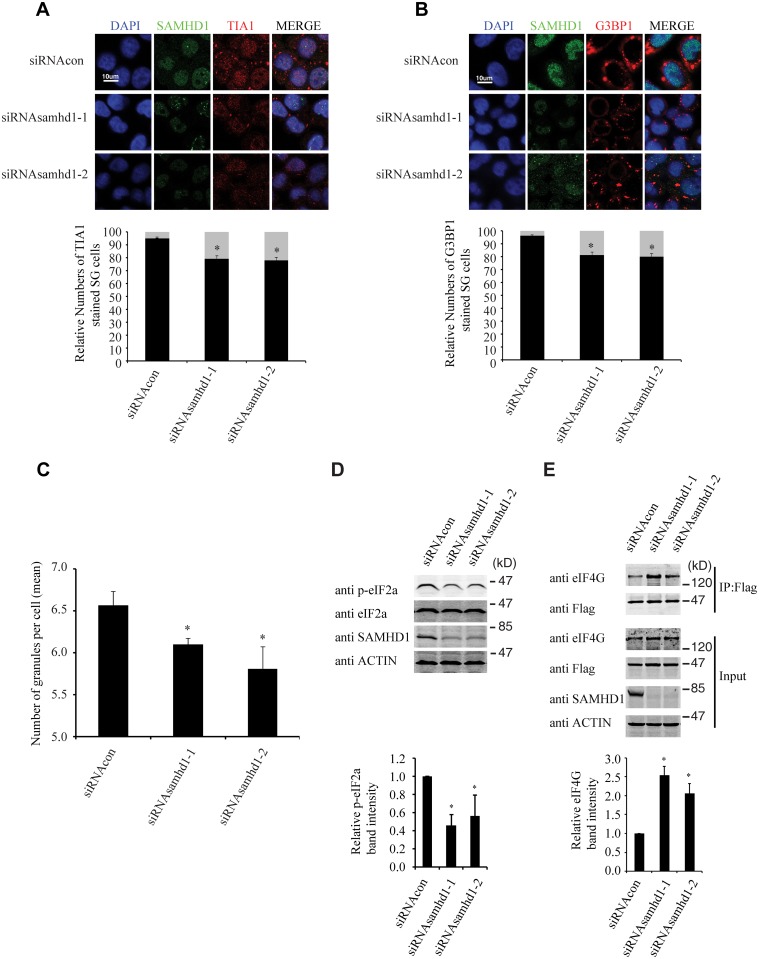
The SAM domain and HD domain containing protein 1 (SAMHD1) inhibits retroviruses, DNA viruses and long interspersed element 1 (LINE-1). Given that in dividing cells, SAMHD1 loses its antiviral function yet still potently restricts LINE-1, we propose that, instead of blocking viral DNA synthesis by virtue of its dNTP triphosphohydrolase activity, SAMHD1 may exploit a different mechanism to control LINE-1. Here, we report a new activity of SAMHD1 in promoting cellular stress granule assembly, which correlates with increased phosphorylation of eIF2α and diminished eIF4A/eIF4G interaction. This function of SAMHD1 enhances sequestration of LINE-1 RNP in stress granules and consequent blockade to LINE-1 retrotransposition. In support of this new mechanism of action, depletion of stress granule marker proteins G3BP1 or TIA1 abrogates stress granule formation and overcomes SAMHD1 inhibition of LINE-1. Together, these data reveal a new mechanism for SAMHD1 to control LINE-1 by activating cellular stress granule pathway.


Conflict of interest statement

The authors have declared that no competing interests exist.

Figures

Fig 1
Fig 1. Ectopic expression of SAMHD1 leads to sequestration of LINE-1 ORF1p in stress granules.
(A, B) The CMV-L1-neoRT DNA and wild type EGFP-SAMHD1 or its H233A mutant DNA were transfected into HeLa cells. Endogenous TIA1 (shown in (A)) and G3BP1 (shown in (B)) were detected by indirect immunofluorescence staining. (C, D) The ORF1-tRFP DNA and wild type EGFP-SAMHD1 or its H233A mutant DNA were transfected into HeLa cells. Endogenous TIA1 (shown in (C)) and G3BP1 (shown in (D)) were detected by indirect immunofluorescence staining. A number of 200 cells were examined for each transfection to score the TIA1- or G3BP1-strained stress granule (SG) cells. The results are summarized in the bar graphs. Colocalization of TIA1 or G3BP1 with ORF1-tRFP was further analyzed with fluorescence intensity analysis software from LAS AF (Leica). (E, F) EGFP-SAMHD1 was expressed in HEK-293 cells. Cellular localizations of SAMHD1 and endogenous LINE-1 ORF1p were determined by immunostaining and confocal microscopy. Endogenous TIA1 (E), G3BP1 (F) and LINE-1 ORF1p were detected by indirect immunofluorescence staining. The number of SG-containing cells was calculated in more than 6 randomly chosen fields for each slide, 200 cells were examined in at least three independent transfections. The results are summarized in the bar graphs. Bars represents 10 μm. Statistical significance (Student's t test) was calculated, * indicates p< 0.05.
Fig 2
Fig 2. ImageStream flow cytometry was utilized to monitor the formation of stress granules and co-localization of SAMDH1 and ORF1p.
HeLa cells were co-transfected with ORF1-tRFP and wild type EGFP-SAMHD1 DNA or the SAMHD1-H233A mutant DNA. Twenty-four hours post transfection, cells were stained with anti-G3BP1 antibody. Automated quantification of stress granule formation on gated cells was performed using the ImageStream technology. (A) Gating of cells. Single cells were first gated in R1, then cells in focus were selected in R2. EGFP and G3BP1 positive cells were selected in R3. tRFP, EGFP and G3BP1 positive cells were finally gated in R4 for imaging and further analysis. (B) Representative bright-field and fluorescence emission images for individual cells from each sample shown. The fluorescent granule inside each cell is clearly visible. (C) A number of 1x10⁴ cells were examined and the frequency of cells with different numbers of G3BP1-positive puncta is presented in the graph. (D) The degree of colocalization of G3BP1 and ORF1p was calculated as the bright detail similarity score. EGFP was utilized as the control. Cells with SAMHD1 overexpression have higher similarity values as a result of greater co-localization of G3BP1 and ORF1p.
Fig 3
Fig 3. Association of LINE-1 RNP with stress granule marker G3BP1.
(A) Schematic illustration of the immunoprecipitation/RT-PCR protocol. LINE-1 RNA that was co-immunoprecipitated (IP) was measured by nest RT-PCR. The PCR products were analyzed by gel electrophoresis followed by extraction from the gel and sequencing. (B) Depiction of the full-length LINE-1 RNA (FL1) and the spliced ORF2 transcript (SpORF2). Arrows indicate the position of the primers used in RT-PCR. This primer pair amplifies a 304 bp sequence of the SpORF2 RNA. (C) HeLa cells were transfected with Flag-ORF1p and CMV-L1-neoRT. Immunoprecipitation was performed with anti-Flag M2 antibodies to pull down Flag-ORF1p as well as ORF1p expressed from CMV-L1-neoRT. The immunoprecipitated materials were treated with or without RNase A during IP as indicated. Presence in the precipitated materials of ORF1p and G3BP1 was determined by western blotting. RT-PCR was performed to measure the levels of LINE-1 RNA in the precipitated samples. The PCR products were analyzed by gel electrophoresis. (D) HeLa cells were co-transfected with Myc-G3BP1 and CMV-L1-neoRT. G3BP1 was precipitated with anti-Myc antibody. The immunoprecipitated materials were treated with or without RNase A during IP as indicated. Co-immunoprecipitation of ORF1p and LINE-1 RNA was determined by western blotting and RT-PCR, respectively. The PCR products were analyzed by gel electrophoresis. The PCR products were also extracted from the gel and sequenced to confirm their being LINE-1 sequence.
Fig 4
Fig 4. SAMHD1 increases LINE-1 RNP sequestration in stress granules.
(A) HeLa cells were co-transfected with CMV-L1-neoRT DNA and wild type Myc-SAMHD1 or SAMHD1-H233A mutant DNA. Endogenous G3BP1 was precipitated with anti-G3BP1 antibody. The anti-rabbit IgG was utilized as a control for non-specific binding. Co-immunoprecipitation of ORF1 and LINE-1 RNA was determined by western blotting and nest RT-PCR, respectively. Intensities of ORF1 bands (western blotting) and LINE-1 RNA bands (nest RT-PCR) were quantified using the ImageJ automated digitizing program (NIH). The results from three independent experiments are summarized in the bar graph. Levels of ORF1 and LINE-1 RNA in the control (SAMHD1 (-), G3BP1 antibody (+)) are arbitrarily set as 1. (B) Co-immunoprecipitation of LINE-1 RNA was determined by real-time quantitative PCR as described in Materials and Methods. The results from three independent experiments are summarized in the bar graph. Levels of ORF1 and LINE-1 RNA in the control (SAMHD1 (-), G3BP1 antibody (+)) are arbitrarily set as 1. (C) HeLa cells were co-transfected with Myc-KPNA2, Flag-ORF1 with or without HA-SAMDH1. Immunoprecipitation was performed with anti-Flag M2 gel. Presence of Myc-KPNA2 in the precipitated materials was determined by western blotting. Intensities of the KPNA2 bands were quantified using the ImageJ automated digitizing program (NIH), the results from three independent experiments are summarized in the bar graph. Level of KPNA2 in the control cells is arbitrarily set as 1. (D) SAMHD1 is not associated with ORF1. HeLa cells were co-transfected with Myc-SAMHD1 DNA and ORF1-Flag DNA. Myc-SAMHD1 was immunoprecipitated with anti-Myc antibody. The presence of ORF1 in the precipitated materials was examined by western blotting. * indicates p<0.05, ns denotes “not significant”.
Fig 5
Fig 5. Stress granule pathway restricts LINE-1 retrotransposition.
(A) The ORF1-tRFP DNA and Myc-G3BP1 DNA were transfected into HeLa cells. Cells were stained with mouse anti-Myc antibody and rabbit anti-TIA1 antibody. (B) The ORF1-tRFP DNA and Myc-TIA1 DNA were transfected into HeLa cells. Cells were stained with mouse anti-Myc antibody and rabbit anti-G3BP1 antibody. The number of SG-containing cells was calculated in more than 6 randomly chosen fields for each slide, and 200 cells were examined in at least three independent transfections. The results are summarized in the bar graphs. (C) HeLa cells were transfected with CMV-L1-neoRT DNA together with SAMHD1, TIA1 or G3BP1 DNA. Neomycin-resistant cell colonies were scored and results of three independent experiments are presented in the bar graph. Number of neomycin-resistant colonies with control vector is arbitrarily set as 1. Results of three independent experiments are shown in the bar graph. Images of a representative colony assay are presented. Ectopic expression of Myc-SAMHD1, Myc-TIA1 or Myc-G3BP1 was examined by western blotting. (D) Knockdown TIA1 or G3BP1 increases LINE-1 activity. HeLa cells were treated with siRNA targeting either TIA1 or G3BP1 prior to transfection with LINE-1 reporter DNA CMV-L1-neoRT. Neomycin-resistant cell colonies were scored and results of three independent experiments are presented in the bar graph. Number of neo-resistant colonies with control siRNA is arbitrarily set as 1. The knockdown of TIA1 or G3BP1 was examined by western blotting. Intensities of TIA1 or G3BP1 bands were determined using the ImageJ program. The results were used to calculate the knockdown efficiency as indicated under the western blots. (E) The CMV-L1-neoRT DNA was transfected into HeLa cells. 6 hours post transfection, cells were cultured in the presence of 1 μM arsenite (AS) for 48h, then fixed and processed for visualization of G3BP1 and ORF1p using fluorescence microscopy. The number of SG-containing cells was calculated in more than 6 randomly chosen fields for each slide, and 200 cells were examined in at least three independent transfections. The results are summarized in the bar graphs in the right panel. Bars represents 10 μm. (F) The LINE-1 EGFP reporter DNA was transfected into 293T cells. Six hours post transfection, cells were treated with 1 μM arsenite for 48 h. GFP-positive cells were scored by flow cytometry at day 5. As a control, cells were also transfected with the pEGFP-C1 vector DNA that constitutively expresses EGFP. Results are normalized to control (without arsenite) and summarized in the bar graphs (n = 3). * indicates p< 0.05, ** represents p< 0.01.
Fig 6
Fig 6. TIA1 and G3BP1 are required for SAMHD1 to inhibit LINE-1 retrotransposition.
(A) Knockdown of TIA1 or G3BP1 prevents the SAMHD1 from inhibiting LINE-1. HeLa cells were transfected with siRNA targeting TIA1 or G3BP1 prior to co-transfection with Myc-SAMHD1 and CMV-L1-neoRT. Neomycin-resistant colonies were scored and results of three independent experiments are shown in the bar graph. Levels of TIA1, G3BP1 and Myc-SAMHD1 were determined by western blotting. The knockdown efficiency of TIA1 and G3BP1 was calculated on the basis of the intensities of TIA1 or G3BP1 bands in the western blots. (B) Endogenous SAMHD1 loses inhibition of LINE-1 upon depletion of TIA1 or G3BP1. HeLa cells were treated with siRNAs targeting TIA1, G3BP1 or SAMHD1, followed by transfection with CMV-L1-neoRT DNA. Number of neomycin-resistant colonies was determined and shown in the bar graph. The number of neomycin-resistant colonies with control siRNA is arbitrarily set as 1. Levels of endogenous TIA1, G3BP1 and SAMHD1 were examined by western blotting. The knockdown efficiency was calculated on the basis of the protein band intensities as determined using the ImageJ program. * indicates p< 0.05, ns denotes “not significant”.
Fig 7
Fig 7. TIA1 and G3BP1 are required for SAMHD1 to form large ORF1p foci.
HeLa cells were transfected with siRNA oligos targeting G3BP1 (A) or TIA1 (B) and plasmid DNA encoding EGFP-SAMHD1 and ORF1-tRFP. Twenty-four hours post transfection, cells were stained with rabbit anti-G3BP1 antibody or anti-TIA1 antibody (blue), Alexa Fluor 647 labeled Goat anti-Rabbit antibody were used as secondary antibodies. Relative number of G3BP1 or TIA1 stained cells means that the percentages of SG-containing cells were calculated in more than 6 randomly chosen fields for each slide with examining 200 cells. The results are summarized in the bar graphs. Bars represents 10 μm. * indicates p< 0.05.
Fig 8
Fig 8. SAMHD1 overexpression induces stress granules formation.
(A, B) HeLa cells were transfected with pcDNA4, EGFP-SAMHD1 or EGFP-SAMHD1-H233A. Cells were collected at 24h post transfection and immunostained for cellular TIA1 (A) or G3BP1 (B). The secondary antibodies used were Alexa Fluor 594-labeled goat anti-Rabbit antibody (red). The proportion of cells with SGs (%) is shown in the bar graphs. The data are shown as the average of three independent experiments. (C, D, E). ImageStream flow cytometry was utilized to monitor the formation of stress granules in the presence of SAMDH1. HeLa cells were transfected with the wild type EGFP-SAMHD1 DNA or the H233A mutant. 48h post transfection, cells were stained with anti-G3BP1 antibody. (C) Cell populations were first gated for single cells (R1) in focus (R2). EGFP and G3BP1 positive cells were then gated in R3 for further analysis. (D) Representative bright-field and fluorescence emission images for individual cells from each sample shown. The fluorescent granule inside each cell is clearly visible. (E) The frequency of cells with different numbers of G3BP1-positive puncta was calculated in a population of 1x10⁴ cells. The results are shown in the graph. Bars represent 10 μm.
Fig 9
Fig 9. SAMHD1 modulates the phosphorylation of eIF2α and the interaction of eIF4G and eIF4A.
(A) Effect of SAMHD1 on eIF2α phosphorylation. HEK-293T cells were transfected with Myc-SAMHD1 or Myc-G3BP1 cDNA. Cells were also treated with arsenite (AS, 500 μM) for 0.5 hour that is known to induce eIF2α phosphorylation. 48h post transfection, cells were treated with Calyculin A (0.1 μM for 30 minutes prior to harvesting cells) to inhibit phosphatases. Western blotting was performed to measure phosphorylation of eIF2α using antibodies as indicated for each gel panel. Intensities of the phosphorylated eIF2α bands were quantified and the results of three independent transfections are shown in the bar graph. pcDNA4 is an empty vector and was used as a transfection control. (B) Lysates were prepared from HeLa cells treated with 1 μM arsenite for 48h. Immunoblotting was performed to analyze phosphorylation of eIF2α (p-eIF2α). (C) Effect of SAMHD1 and SAMHD1-H233A on the association of eIF4A and eIF4G. HeLa cells were transfected with Flag-eIF4A together with Myc-SAMHD1 or Myc-SAMHD1-H233A DNA. Flag-eIF4A was immunoprecipitated with anti-Flag M2 antibodies. Western blots were performed with rabbit anti-Flag, rabbit anti-eIF4G, rabbit anti-Myc (to detect Myc-SAMHD1), or mouse anti-actin antibodies. Intensities of the eIF4G bands were quantified using the ImageJ automated digitizing program (NIH). The bar graph shows the results of three independent transfection experiments. * indicates p < 0.05, ns denotes “not significant”.
Fig 10
Fig 10. Knockdown of SAMHD1 diminishes the formation of stress granules.
(A, B) HeLa cells were transfected with siRNA oligos targeting SAMHD1. 72h post transfection, cells were treated with arsenite (500 μM) for 30 min to induce stress granules. Cells were then stained with mouse anti-SAMHD1 antibody and rabbit anti-TIA1 (A) or anti-G3BP1 (B) antibody. Alexa Fluor 488 labeled goat anti-rabbit antibody or Alexa Fluor 594 labeled goat anti-rabbit antibody was used as the secondary antibody. (C) The Operetta High-Content Screen system (PerkinElmer) was utilized to score the number of G3BP1-positive stress granules in HeLa cells that were transfected with siRNA targeting SAMHD1 or control siRNA. Cells were treated with arsenite (500 μM) for 30 min to induce stress granules. The average numbers of stress granules in the control or SAMHD1-knockdown cells are shown in the bar graph. (D) The endogenous SAMHD1 in HeLa cells was first knocked down with siRNA, followed by treatment with arsenite (500 μM) for 30 min. Western blotting was performed to measure phosphorylation of eIF2α using specific antibodies as indicated for each panel. Intensities of the phosphorylated eIF2α bands were quantified using the ImageJ automated digitizing program (NIH) and results are summarized in the bar graph. Results shown are the average of three independent experiments. (E) HeLa cells were transfected with siRNA targeting SAMHD1 prior to transfection with Flag-eIF4A. Flag-eIF4A was immunoprecipitated with mouse anti-Flag antibody and probed with rabbit anti-Flag, rabbit anti-eIF4G, mouse anti-SAMHD1 or mouse anti-actin antibodies. Intensities of the eIF4G bands were quantified and the results of three independent transfection experiments are summarized in the bar graph. Bars represents 10 μm. * denotes p<0.05.

Similar articles

Cited by

References

    1. Li N, Zhang W, Cao X (2000) Identification of human homologue of mouse IFN-gamma induced protein from human dendritic cells. Immunology letters 74: 221–224. - PubMed
    1. Rice GI, Bond J, Asipu A, Brunette RL, Manfield IW, et al. (2009) Mutations involved in Aicardi-Goutieres syndrome implicate SAMHD1 as regulator of the innate immune response. Nat Genet 41: 829–832. 10.1038/ng.373 - DOI - PMC - PubMed
    1. Fazzi E, Cattalini M, Orcesi S, Tincani A, Andreoli L, et al. (2012) Aicardi-Goutieres syndrome, a rare neurological disease in children: a new autoimmune disorder? Autoimmun Rev 12: 506–509. 10.1016/j.autrev.2012.08.012 - DOI - PubMed
    1. Goldstone DC, Ennis-Adeniran V, Hedden JJ, Groom HC, Rice GI, et al. (2011) HIV-1 restriction factor SAMHD1 is a deoxynucleoside triphosphate triphosphohydrolase. Nature 480: 379–382. 10.1038/nature10623 - DOI - PubMed
    1. Powell RD, Holland PJ, Hollis T, Perrino FW (2011) Aicardi-Goutieres syndrome gene and HIV-1 restriction factor SAMHD1 is a dGTP-regulated deoxynucleotide triphosphohydrolase. J Biol Chem 286: 43596–43600. 10.1074/jbc.C111.317628 - DOI - PMC - PubMed

Publication types

MeSH terms

Grants and funding

This study was supported by funds from the Ministry of Science and Technology of China (2012CB911103; 2011CB5048002; 2012ZX10001006-003 and 2013ZX10001005-002) (FG), from the Nature Science Foundation of China (81371808 to FG; 81301439 to SH) and Canadian Institutes of Health Research (CCI-132561) (CL). The funders had no role in study design, data collection and analysis, decision to publish, or preparation of the manuscript.