HIV Reactivation from Latency after Treatment Interruption Occurs on Average Every 5-8 Days--Implications for HIV Remission
- PMID: 26133551
- PMCID: PMC4489624
- DOI: 10.1371/journal.ppat.1005000
HIV Reactivation from Latency after Treatment Interruption Occurs on Average Every 5-8 Days--Implications for HIV Remission
Erratum in
-
Correction: HIV Reactivation from Latency after Treatment Interruption Occurs on Average Every 5-8 Days-Implications for HIV Remission.PLoS Pathog. 2016 Aug 25;12(8):e1005745. doi: 10.1371/journal.ppat.1005745. eCollection 2016 Aug. PLoS Pathog. 2016. PMID: 27561082 Free PMC article.
Abstract
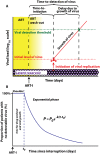
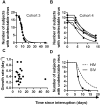
HIV infection can be effectively controlled by anti-retroviral therapy (ART) in most patients. However therapy must be continued for life, because interruption of ART leads to rapid recrudescence of infection from long-lived latently infected cells. A number of approaches are currently being developed to 'purge' the reservoir of latently infected cells in order to either eliminate infection completely, or significantly delay the time to viral recrudescence after therapy interruption. A fundamental question in HIV research is how frequently the virus reactivates from latency, and thus how much the reservoir might need to be reduced to produce a prolonged antiretroviral-free HIV remission. Here we provide the first direct estimates of the frequency of viral recrudescence after ART interruption, combining data from four independent cohorts of patients undergoing treatment interruption, comprising 100 patients in total. We estimate that viral replication is initiated on average once every ≈6 days (range 5.1- 7.6 days). This rate is around 24 times lower than previous thought, and is very similar across the cohorts. In addition, we analyse data on the ratios of different 'reactivation founder' viruses in a separate cohort of patients undergoing ART-interruption, and estimate the frequency of successful reactivation to be once every 3.6 days. This suggests that a reduction in the reservoir size of around 50-70-fold would be required to increase the average time-to-recrudescence to about one year, and thus achieve at least a short period of anti-retroviral free HIV remission. Our analyses suggests that time-to-recrudescence studies will need to be large in order to detect modest changes in the reservoir, and that macaque models of SIV latency may have much higher frequencies of viral recrudescence after ART interruption than seen in human HIV infection. Understanding the mean frequency of recrudescence from latency is an important first step in approaches to prolong antiretroviral-free viral remission in HIV.
Conflict of interest statement
The authors have declared that no competing interests exist.
Figures


Similar articles
-
Relationship between Measures of HIV Reactivation and Decline of the Latent Reservoir under Latency-Reversing Agents.J Virol. 2017 Apr 13;91(9):e02092-16. doi: 10.1128/JVI.02092-16. Print 2017 May 1. J Virol. 2017. PMID: 28202759 Free PMC article.
-
Modeling of Antilatency Treatment in HIV: What Is the Optimal Duration of Antiretroviral Therapy-Free HIV Remission?J Virol. 2017 Nov 30;91(24):e01395-17. doi: 10.1128/JVI.01395-17. Print 2017 Dec 15. J Virol. 2017. PMID: 29021399 Free PMC article.
-
Estimating Initial Viral Levels during Simian Immunodeficiency Virus/Human Immunodeficiency Virus Reactivation from Latency.J Virol. 2018 Jan 2;92(2):e01667-17. doi: 10.1128/JVI.01667-17. Print 2018 Jan 15. J Virol. 2018. PMID: 29118123 Free PMC article.
-
Therapeutics for HIV-1 reactivation from latency.Curr Opin Virol. 2013 Aug;3(4):394-401. doi: 10.1016/j.coviro.2013.06.001. Epub 2013 Jun 28. Curr Opin Virol. 2013. PMID: 23810462 Review.
-
Challenges and Promise of Human Immunodeficiency Virus Remission.J Infect Dis. 2021 Feb 15;223(12 Suppl 2):4-12. doi: 10.1093/infdis/jiaa568. J Infect Dis. 2021. PMID: 33586773 Free PMC article. Review.
Cited by
-
Development of 5' LTR DNA methylation of latent HIV-1 provirus in cell line models and in long-term-infected individuals.Clin Epigenetics. 2016 Feb 19;8:19. doi: 10.1186/s13148-016-0185-6. eCollection 2016. Clin Epigenetics. 2016. PMID: 26900410 Free PMC article.
-
Modeling Kick-Kill Strategies toward HIV Cure.Front Immunol. 2017 Aug 28;8:995. doi: 10.3389/fimmu.2017.00995. eCollection 2017. Front Immunol. 2017. PMID: 28894444 Free PMC article. Review.
-
Kill: boosting HIV-specific immune responses.Curr Opin HIV AIDS. 2016 Jul;11(4):409-16. doi: 10.1097/COH.0000000000000286. Curr Opin HIV AIDS. 2016. PMID: 27054280 Free PMC article. Review.
-
Epigenetics and Genetics of Viral Latency.Cell Host Microbe. 2016 May 11;19(5):619-28. doi: 10.1016/j.chom.2016.04.008. Cell Host Microbe. 2016. PMID: 27173930 Free PMC article. Review.
-
The Glutamate System as a Crucial Regulator of CNS Toxicity and Survival of HIV Reservoirs.Front Cell Infect Microbiol. 2020 Jun 24;10:261. doi: 10.3389/fcimb.2020.00261. eCollection 2020. Front Cell Infect Microbiol. 2020. PMID: 32670889 Free PMC article. Review.
References
Publication types
MeSH terms
Substances
Grants and funding
LinkOut - more resources
Full Text Sources
Other Literature Sources
Medical

