

Impact of Weight Loss on Plasma Leptin and Adiponectin in Overweight-to-Obese Post Menopausal Breast Cancer Survivors
- PMID: 26132992
- PMCID: PMC4516992
- DOI: 10.3390/nu7075156
Impact of Weight Loss on Plasma Leptin and Adiponectin in Overweight-to-Obese Post Menopausal Breast Cancer Survivors
Abstract
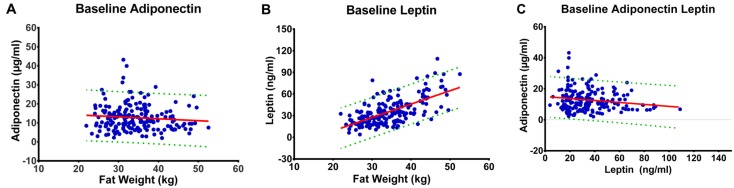
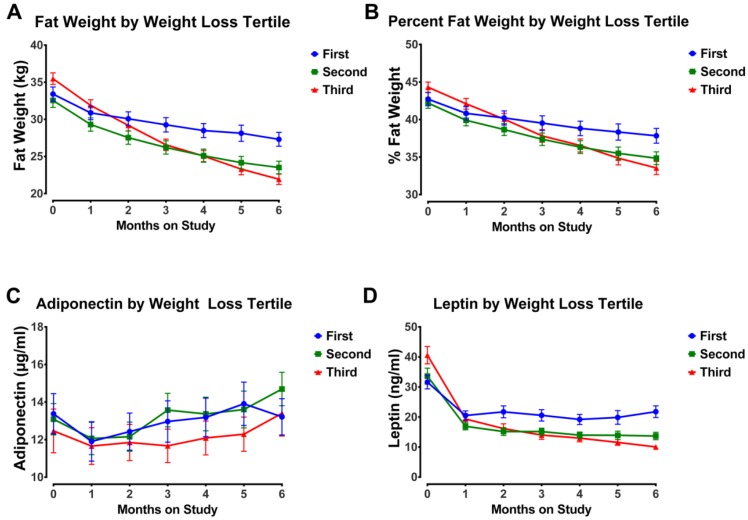
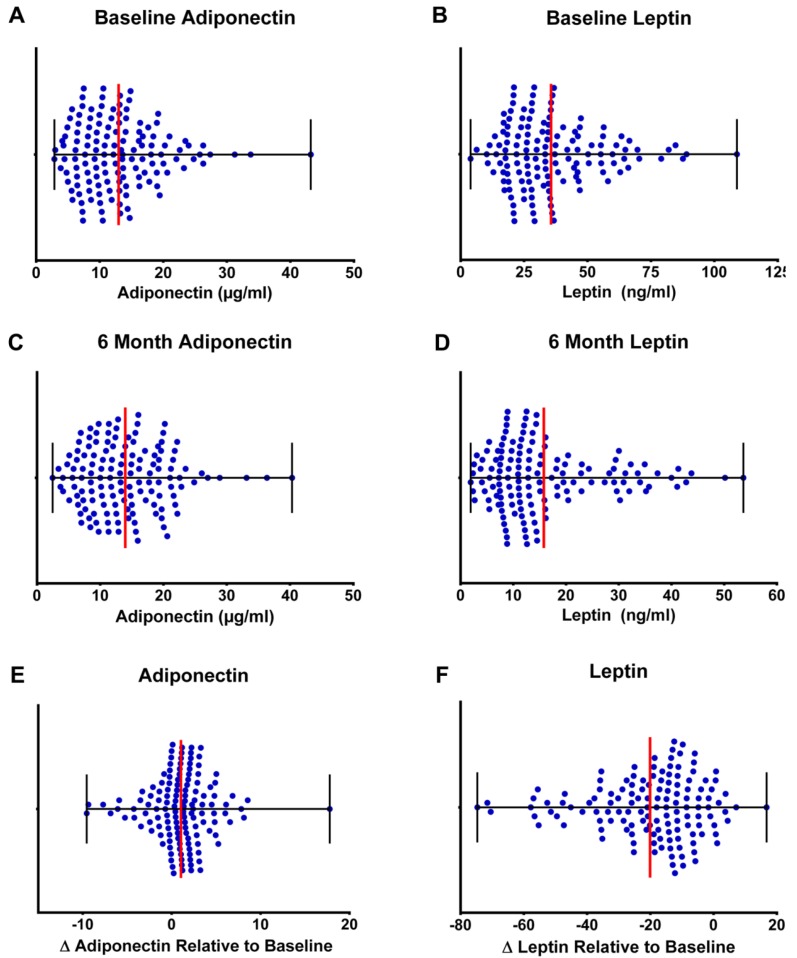
Women who are obese at the time of breast cancer diagnosis have higher overall mortality than normal weight women and some evidence implicates adiponectin and leptin as contributing to prognostic disadvantage. While intentional weight loss is thought to improve prognosis, its impact on these adipokines is unclear. This study compared the pattern of change in plasma leptin and adiponectin in overweight-to-obese post-menopausal breast cancer survivors during weight loss. Given the controversies about what dietary pattern is most appropriate for breast cancer control and regulation of adipokine metabolism, the effect of a low fat versus a low carbohydrate pattern was evaluated using a non-randomized, controlled study design. Anthropometric data and fasted plasma were obtained monthly during the six-month weight loss intervention. While leptin was associated with fat mass, adiponectin was not, and the lack of correlation between leptin and adiponectin concentrations throughout weight loss implies independent mechanisms of regulation. The temporal pattern of change in leptin but not adiponectin was affected by magnitude of weight loss. Dietary pattern was without effect on either adipokine. Mechanisms not directly related to dietary pattern, weight loss, or fat mass appear to play dominant roles in the regulation of circulating levels of these adipokines.
Keywords: adiponectin; body composition; breast cancer survivors; dietary pattern; leptin; weight loss.
Figures

Similar articles
-
Effect of a low fat versus a low carbohydrate weight loss dietary intervention on biomarkers of long term survival in breast cancer patients ('CHOICE'): study protocol.BMC Cancer. 2011 Jul 6;11:287. doi: 10.1186/1471-2407-11-287. BMC Cancer. 2011. PMID: 21733177 Free PMC article. Clinical Trial.
-
Adiponectin levels do not change with moderate dietary induced weight loss and exercise in obese postmenopausal women.Int J Obes Relat Metab Disord. 2003 Sep;27(9):1066-71. doi: 10.1038/sj.ijo.0802387. Int J Obes Relat Metab Disord. 2003. PMID: 12917712
-
WISER Survivor Trial: Combined Effect of Exercise and Weight Loss Interventions on Adiponectin and Leptin Levels in Breast Cancer Survivors with Overweight or Obesity.Nutrients. 2023 Aug 4;15(15):3453. doi: 10.3390/nu15153453. Nutrients. 2023. PMID: 37571390 Free PMC article.
-
Reliability of leptin, but not adiponectin, as a biomarker for diet-induced weight loss in humans.Nutr Rev. 2011 Mar;69(3):145-54. doi: 10.1111/j.1753-4887.2011.00373.x. Epub 2011 Feb 14. Nutr Rev. 2011. PMID: 21348878 Review.
-
Leptin and adiponectin in the female life course.Braz J Med Biol Res. 2011 May;44(5):381-7. Epub 2011 Mar 29. Braz J Med Biol Res. 2011. PMID: 21445529 Review.
Cited by
-
Oncogenic role of leptin and Notch interleukin-1 leptin crosstalk outcome in cancer.World J Methodol. 2016 Mar 26;6(1):43-55. doi: 10.5662/wjm.v6.i1.43. eCollection 2016 Mar 26. World J Methodol. 2016. PMID: 27019796 Free PMC article. Review.
-
Comparison of cricket diet with peanut-based and milk-based diets in the recovery from protein malnutrition in mice and the impact on growth, metabolism and immune function.PLoS One. 2020 Jun 11;15(6):e0234559. doi: 10.1371/journal.pone.0234559. eCollection 2020. PLoS One. 2020. PMID: 32525953 Free PMC article.
-
Toward the optimal strategy for sustained weight loss in overweight cancer survivors: a systematic review of the literature.J Cancer Surviv. 2017 Jun;11(3):360-385. doi: 10.1007/s11764-016-0594-8. Epub 2017 Jan 18. J Cancer Surviv. 2017. PMID: 28097452 Free PMC article. Review.
-
Baseline predictors associated with successful weight loss among breast cancer survivors in the Lifestyle, Exercise, and Nutrition (LEAN) study.J Cancer Surviv. 2024 Nov 11. doi: 10.1007/s11764-024-01702-3. Online ahead of print. J Cancer Surviv. 2024. PMID: 39528779
-
Impact of a behaviorally-based weight loss intervention on parameters of insulin resistance in breast cancer survivors.BMC Cancer. 2018 Mar 27;18(1):351. doi: 10.1186/s12885-018-4272-2. BMC Cancer. 2018. PMID: 29587682 Free PMC article.
References
-
- Ewertz M., Jensen M.B., Gunnarsdottir K.A., Hojris I., Jakobsen E.H., Nielsen D., Stenbygaard L.E., Tange U.B., Cold S. Effect of obesity on prognosis after early-stage breast cancer. J. Clin. Oncol. 2011;29:25–31. - PubMed
-
- Protani M., Coory M., Martin J.H. Effect of obesity on survival of women with breast cancer: Systematic review and meta-analysis. Breast Cancer Res. Treat. 2010;123:627–635. - PubMed
-
- Al-Delaimy W.K., Flatt S.W., Natarajan L., Laughlin G.A., Rock C.L., Gold E.B., Caan B.J., Parker B.A., Pierce J.P. IGF1 and risk of additional breast cancer in the WHEL study. Endocr. Relat. Cancer. 2011;18:235–244. - PubMed
Publication types
MeSH terms
Substances
Grants and funding
LinkOut - more resources
Full Text Sources
Other Literature Sources
Medical
Miscellaneous
