. 2015 Jul 1;10(7):e0129711.
doi: 10.1371/journal.pone.0129711. eCollection 2015.

The Discovery of Novel Biomarkers Improves Breast Cancer Intrinsic Subtype Prediction and Reconciles the Labels in the METABRIC Data Set

Affiliations

The Discovery of Novel Biomarkers Improves Breast Cancer Intrinsic Subtype Prediction and Reconciles the Labels in the METABRIC Data Set

Heloisa Helena Milioli et al. PLoS One. .

Abstract

Background: The prediction of breast cancer intrinsic subtypes has been introduced as a valuable strategy to determine patient diagnosis and prognosis, and therapy response. The PAM50 method, based on the expression levels of 50 genes, uses a single sample predictor model to assign subtype labels to samples. Intrinsic errors reported within this assay demonstrate the challenge of identifying and understanding the breast cancer groups. In this study, we aim to: a) identify novel biomarkers for subtype individuation by exploring the competence of a newly proposed method named CM1 score, and b) apply an ensemble learning, as opposed to the use of a single classifier, for sample subtype assignment. The overarching objective is to improve class prediction.

Methods and findings: The microarray transcriptome data sets used in this study are: the METABRIC breast cancer data recorded for over 2000 patients, and the public integrated source from ROCK database with 1570 samples. We first computed the CM1 score to identify the probes with highly discriminative patterns of expression across samples of each intrinsic subtype. We further assessed the ability of 42 selected probes on assigning correct subtype labels using 24 different classifiers from the Weka software suite. For comparison, the same method was applied on the list of 50 genes from the PAM50 method.

Conclusions: The CM1 score portrayed 30 novel biomarkers for predicting breast cancer subtypes, with the confirmation of the role of 12 well-established genes. Intrinsic subtypes assigned using the CM1 list and the ensemble of classifiers are more consistent and homogeneous than the original PAM50 labels. The new subtypes show accurate distributions of current clinical markers ER, PR and HER2, and survival curves in the METABRIC and ROCK data sets. Remarkably, the paradoxical attribution of the original labels reinforces the limitations of employing a single sample classifiers to predict breast cancer intrinsic subtypes.


Conflict of interest statement

Competing Interests: The authors have declared that no competing interests exist.

Figures

Fig 1
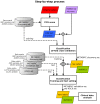
Fig 1. The step-by-step process.
The image shows the method steps based on CM1 score and ensemble learning. The METABRIC discovery set is used to compute the CM1 score, based on the original labels previously assigned with the PAM50 method. This step has an output of 42 discriminative probes selected, the CM1 list. The following step involve the sample subtype classification based on a 10-fold cross-validation. Samples in the METABRIC discovery set are considered to train 24 classifiers using the CM1 list and, alternatively, the PAM50 list. The samples are partitioned into ten folds; then a model is built using 90% of samples, which is used to predict the labels of the remaining 10%. After the ten turns are finished, the level of association between the predicted and original METABRIC labels is computed using several statistics. In the training-test setting, labels of samples in the METABRIC validation set and ROCK set are predicted with the models built in the discovery. Statistics measurements are again computed to assess the model performance on predicting breast cancer subtypes. In both classification steps, the new labels are attributed based on the consensus of the majority of the classifiers. Finally, the results or new labels are compared against the clinical data, the current markers ER, PR and HER2, and survival curves.
Fig 2
Fig 2. The gene expression profile of the balanced top ten probes selected for each of the five breast cancer intrinsic subtypes across 997 samples from the discovery set.
The annotated genes are defined for each subtype as an intrinsic, highly discriminative, signature. Samples were ordered according to the gene expression similarities in each breast cancer subtype. Colours represent the selected genes and sample subtypes: luminal A (yellow), luminal B (green), HER2-enriched (purple), normal-like (blue), and basal-like (red).
Fig 3
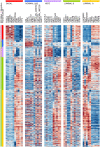
Fig 3. Gene expression patterns of the 42 probes selected using the CM1 score.
The heat map diagram exhibit 42 probes (rows) and 997 samples (columns) from the discovery set ordered according to gene expression similarity, based on a memetic algorithm [27]. The labels highlighted on top show the sample distribution according to the ER positive and negative status. It also illustrates the original PAM50 subtypes luminal A (yellow), luminal B (green), HER2-enriched (purple), normal-like (blue), and basal-like (red) in the METABRIC discovery set. Two probes in the CM1 list refer to the same gene, HPN, which was then appended with the corresponding Illumina probe ID.
Fig 4
Fig 4. The mRNA log2 normalised expression values of 7 novel highly discriminative biomarkers across the five intrinsic subtypes in the METABRIC discovery and validation sets, and ROCK set.
The box plot uncover the values of 997 samples in the METABRIC discovery set, 989 in the validation set, and 1570 in the ROCK test set.
Fig 5
Fig 5. Class distribution in the METABRIC discovery and validation sets, and in the ROCK set.
The bars represent the number of samples in each breast cancer subtype. In the first row, the labels refer to the original assignment using the PAM50 method. The following rows show the new labels attributed using an ensemble of 24 classifiers with PAM50 and CM1 lists, respectively. Samples were classified as inconsistent if there was no consensus between the majority of classifiers as to what should be the correct subtype.
Fig 6
Fig 6. Similarity between subtypes distribution in the METABRIC discovery and validation sets, and in the ROCK set.
The image shows the similarity between the subtypes distribution for METABRIC discovery (MD) and validation (MD) sets, and ROCK test set (RS). The labels were assigned in the original data sets using the PAM50 method, and relabelled in this study with an ensemble learning using PAM50 and CM1 lists. The similarity is measured using the square root of the Jensen-Shannon divergence. Darker shades represent more similar distributions, while lighter shades refer to divergent patterns. The diagonal shows the darkest color as each data set is the closest to itself. According to this image, labels assigned using an ensemble learning with CM1 and PAM50 lists are highly similar, and both exhibit lower levels of agreement with the original labels assigned using a single classifier (PAM), or PAM50 method.
Fig 7
Fig 7. ER marker distribution across subtypes in the METABRIC data sets.
(A) Discovery and (B) Validation. The bars represent the number of samples with ER positive and negative in the five intrinsic subtypes, based on the patients’ clinical information. The top row is based on the original subtype labels obtained with the PAM50 list and a single classifier (PAM). Middle and bottom rows are based on the labels obtained by Ensemble Learning using the PAM50 and CM1 lists, respectively.
Fig 8
Fig 8. PR marker distribution across subtypes in the METABRIC data set.
(A) Discovery and (B) Validation. The bars represent the number of samples with PR positive and negative distributed in the five intrinsic subtypes, based on the patients’ clinical information. The top row is based on the original subtype labels obtained with the PAM50 list and a single classifier (PAM). Middle and bottom rows are based on the labels obtained by Ensemble Learning using the PAM50 and CM1 lists, respectively.
Fig 9
Fig 9. HER2 distribution across subtypes in the METABRIC data sets.
(A) Discovery and (B) Validation. The bars represent the number of samples with HER2 amplification (positive or negative) for each intrinsic subtype based on the patients’ clinical information. The top row is based on the original subtype labels obtained with the PAM50 list and a single classifier (PAM). Middle and bottom rows are based on the labels obtained by Ensemble Learning using the PAM50 and CM1 lists, respectively.
Fig 10
Fig 10. The survival curves for METABRIC discovery and validation sets.
The survival curves for each breast cancer subtype are generated using Cox proportional hazards model based on the grade and size of the tumour, patient’s age, number of lymph nodes positive and ER status. Each curve represents the survival probability at a certain time after the diagnosis. Ticks on the curve correspond to the observations of patients who are still alive, while drops indicate the death. The probability curves based on the last 10 observations are plotted in dash. The top row is based on the original subtype labels obtained with the PAM50 list and a single classifier (PAM). Middle and bottom rows are based on the labels obtained by Ensemble Learning using the PAM50 and CM1 lists, respectively.

Similar articles

Cited by

References

    1. Reis-Filho JS, Pusztai L. Gene expression profiling in breast cancer: classification, prognostication, and prediction. The Lancet. 2011;378(9805):1812–1823. 10.1016/S0140-6736(11)61539-0 - DOI - PubMed
    1. Portier BP, Gruver AM, Huba MA, Minca EC, Cheah AL, Wang Z, et al. From morphologic to molecular: established and emerging molecular diagnostics for breast carcinoma. N Biotechnol. 2012;29(6):665–81. 10.1016/j.nbt.2012.03.011 - DOI - PubMed
    1. van’t Veer LJ, Dai H, van de Vijver MJ, He YD, Hart AAM, Mao M, et al. Gene expression profiling predicts clinical outcome of breast cancer. Nature. 2002;415:530–536. 10.1038/415530a - DOI - PubMed
    1. Prat A, Ellis MJ, Perou CM. Practical implications of gene-expression-based assays for breast oncologists. Nat Rev Clin Oncol. 2012;9(1):48–57. 10.1038/nrclinonc.2011.178 - DOI - PMC - PubMed
    1. Kelly CM, Bernard PS, Krishnamurthy S, Wang B, Ebbert MT, Bastien RR, et al. Agreement in risk prediction between the 21-gene recurrence score assay (Oncotype DX(R)) and the PAM50 breast cancer intrinsic Classifier in early-stage estrogen receptor-positive breast cancer. Oncologist. 2012;17(4):492–498. 10.1634/theoncologist.2012-0007 - DOI - PMC - PubMed

Publication types

Substances

Grants and funding

PM is supported by Australian Research Council (ARC) Future Fellowship FT120100060 (http://arc.gov.au/). This project is partially funded by Australian Research Council Discovery Project DP120102576 (http://arc.gov.au/) and Cancer Institute of New South Wales, Australia, Grant 13/DATA/1-03 (http://www.cancerinstitute.org.au/). The funders had no role in study design, data collection and analysis, decision to publish, or preparation of the manuscript.