. 2015 Jun 29;5(3):1284-301.
doi: 10.3390/biom5031284.

Study of Protein Phosphatase 2A (PP2A) Activity in LPS-Induced Tolerance Using Fluorescence-Based and Immunoprecipitation-Aided Methodology

Affiliations

Study of Protein Phosphatase 2A (PP2A) Activity in LPS-Induced Tolerance Using Fluorescence-Based and Immunoprecipitation-Aided Methodology

Lei Sun et al. Biomolecules. .

Abstract

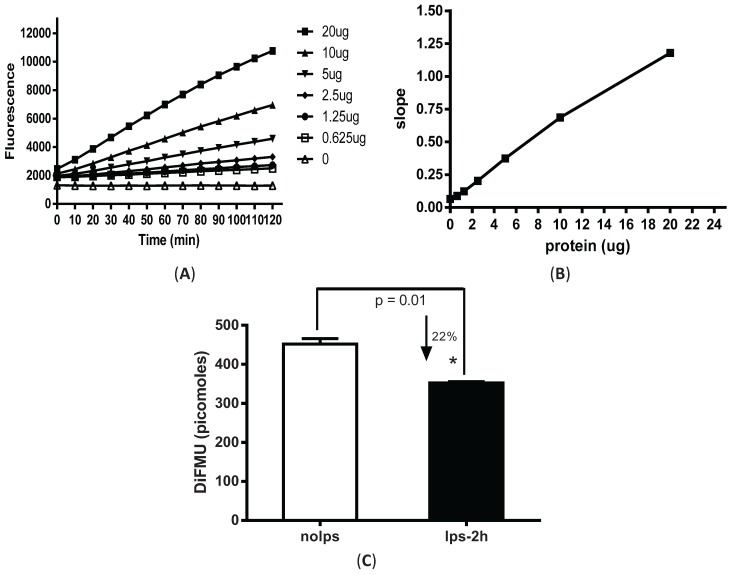
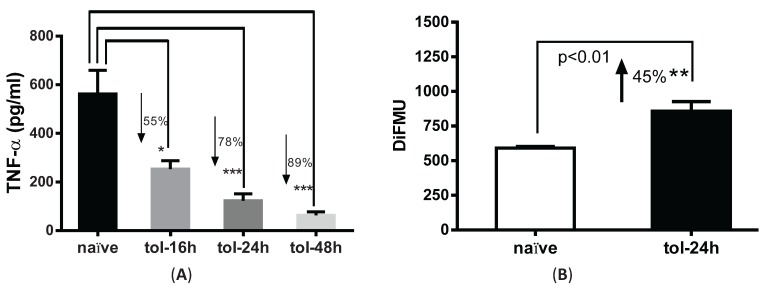
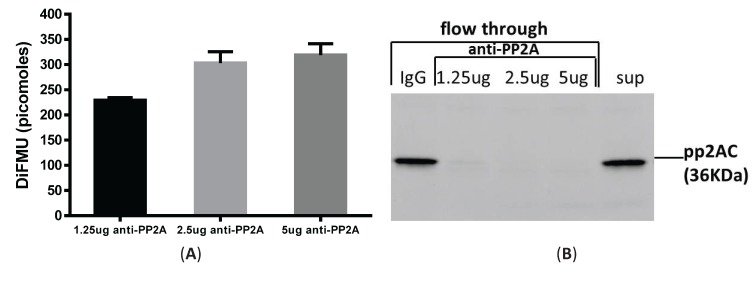
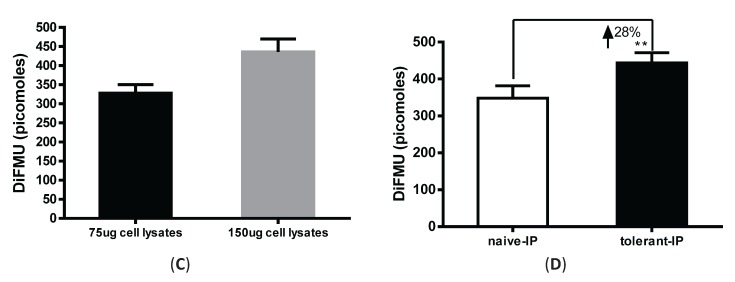
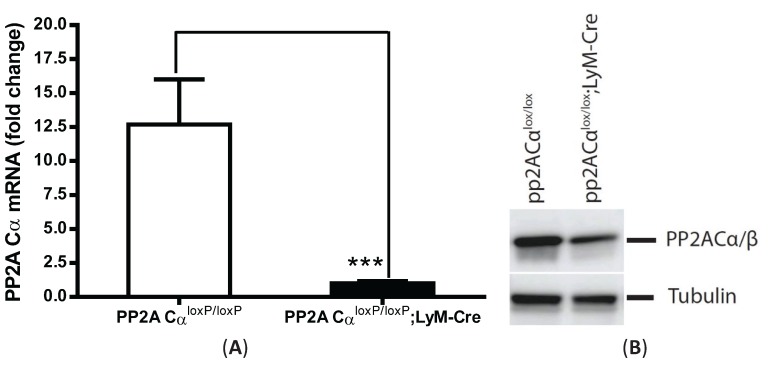
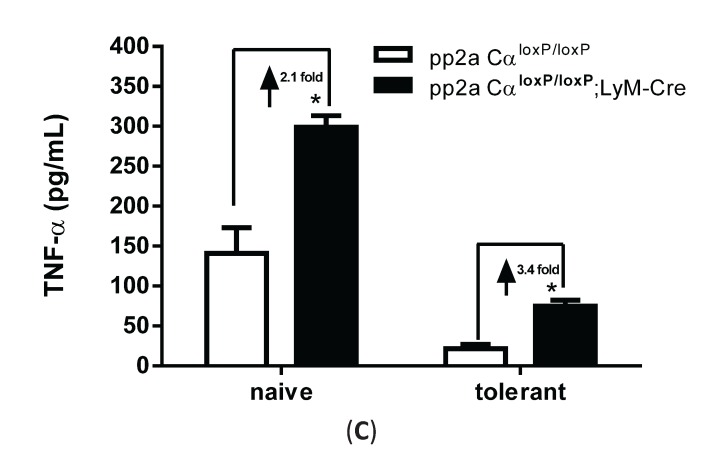
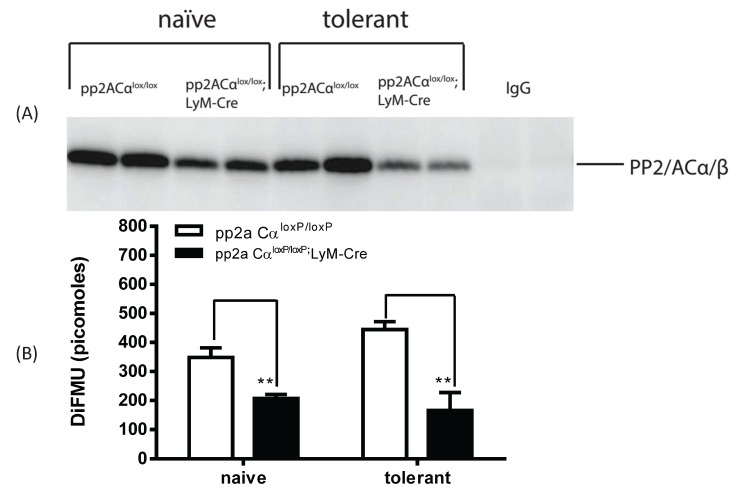
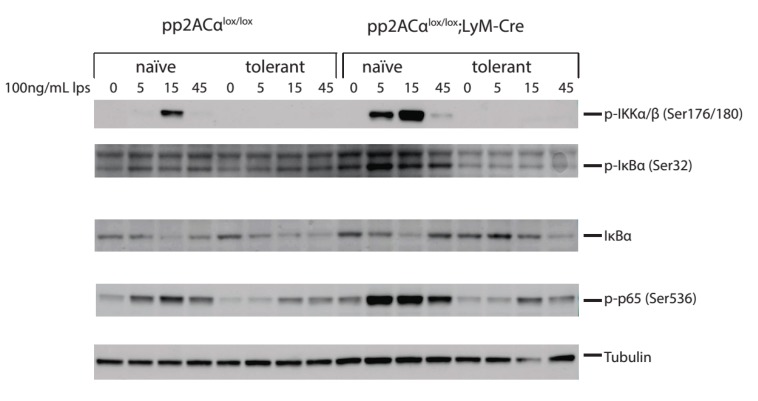
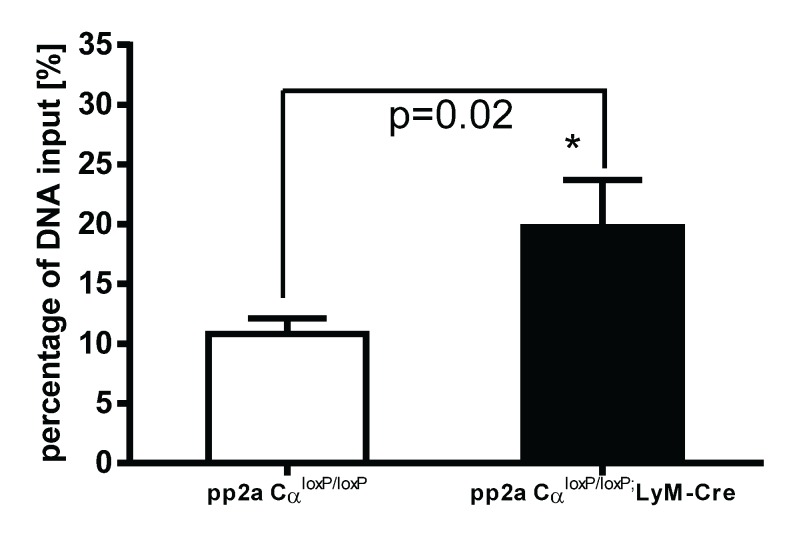
Protein phosphatase 2A (PP2A) is one of the most abundant intracellular serine/threonine (Ser/Thr) phosphatases accounting for 1% of the total cellular protein content. PP2A is comprised of a heterodimeric core enzyme and a substrate-specific regulatory subunit. Potentially, at least seventy different compositions of PP2A exist because of variable regulatory subunit binding that accounts for various activity modulating numerous cell functions. Due to the constitutive phosphatase activity present inside cells, a sensitive assay is required to detect the changes of PP2A activity under various experimental conditions. We optimized a fluorescence assay (DIFMU assay) by combining it with prior anti-PP2A immunoprecipitation to quantify PP2A-specific phosphatase activity. It is also known that prior exposure to lipopolysaccharides (LPS) induces "immune tolerance" of the cells to subsequent stimulation. Herein we report that PP2A activity is upregulated in tolerized peritoneal macrophages, corresponding to decreased TNF-α secretion upon second LPS stimulation. We further examined the role of PP2A in the tolerance effect by using PP2ACαl°xl°x;lyM-Cre conditional knockout macrophages. We found that PP2A phosphatase activity cannot be further increased by tolerance. TNF-α secretion from tolerized PP2ACαl°xl°x;lyM-Cre macrophages is higher than tolerized control macrophages. Furthermore, we showed that the increased TNF-α secretion may be due to an epigenetic transcriptionally active signature on the promoter of TNF-α gene rather than regulation of the NFκB/IκB signaling pathway. These results suggest a role for increased PP2A activity in the regulation of immune tolerance.

Keywords: PP2A; immune tolerance; phosphatase assay.


Figures

Figure 1
Figure 1
Fluorescence-based phosphatase assay in LPS-stimulated peritoneal macrophages. Elicited peritoneal macrophages were harvested from C57BL6 mice at day 4 after thioglycollate injection. Cells were lysed with imidazole buffer and protein concentration was measured by BCA assay. (A) Time-course and dose-dependent responses measured from total cell lysates in buffers containing non-fluorescent substrate DiFMUP and NiCl2 additive. Y-axis shows the fluorescence reading as random light units; (B) Slope reaction. Slope value represents reaction rates which are calculated by dividing the changes of enzyme activity by time (from kinetic reaction). Assay kinetic was set from 0 to 120 min with an interval value of 10 min; (C) Down-regulation of phosphatase activity in LPS-stimulated macrophages (100 ng/mL LPS for 2 h). Absolute value of DiFMU on the Y-axis was calculated based on DiFMU standard curve. * p = 0.01 as compared to non-LPS treated cells.
Figure 2
Figure 2
Pre-treatment with LPS induced tolerance and upregulation of phosphatase activity in peritoneal macrophages. (A) Peritoneal macrophages harvested from C57BL6 mice were pre-treated with 100 ng/mL LPS for 16, 24 and 48 h and subjected to second LPS stimulation for 4 h. Supernatants were collected and measured for TNF-α secretion. * p < 0.05; *** p < 0.001 as compared to naïve cells; (B) Phosphatase activity in LPS-tolerized macrophages. Cells were treated with 100 ng/mL of LPS for 24 h, lysed and subjected for phosphatase assay. Y axis shows the absolute value of DiFMU present in the solution. ** p < 0.05 as compared to non-tolerized cells.
Figure 3
Figure 3
Immunoprecipitation-aided fluorescence method of measuring PP2A activity in tolerized peritoneal macrophages. Anti-PP2A IgG was incubated with Protein A/G magnetic beads for 30 min and then cross-linked to the beads by DSS. Cell lysates were then incubated with antibody-conjugated beads for 1 hr at room temperature and the beads were removed of were washed to remove non-specific binding. Assay buffer containing DiFMUP and NiCl2 was added to the beads, mixed and incubated at room temperature for 30 min. Supernatant removed of beads was measured on a SpectraMax M3 plate reader. (A) Anti-PP2A dose-response. Three doses of anti-PP2A IgG were cross-linked to the beads and incubated with the same amount of input lysates (75 µg) for the phosphatase assay; (B) Flow through section after beads were removed was examined for the presence of PP2A to determine pulldown efficiency; (C) Input cell lysates dose-response. Same amount of anti-PP2A IgG (2.5 µg) was incubated with two doses of cell lysates (75 µg and 150 µg). PP2A activity was measured by DiFMU method. Y axis shows the absolute values of DiFMU in solutions; (D) LPS tolerance induced upregulated PP2A-activity in peritoneal macrophages. 75 µg of cell lysates harvested from naïve or tolerant peritoneal macrophages were subjected to immunoprecipitation with 2.5 µg of anti-PP2AC antibody. Y-axis shows the absolute values of DiFMU.
Figure 3
Figure 3
Immunoprecipitation-aided fluorescence method of measuring PP2A activity in tolerized peritoneal macrophages. Anti-PP2A IgG was incubated with Protein A/G magnetic beads for 30 min and then cross-linked to the beads by DSS. Cell lysates were then incubated with antibody-conjugated beads for 1 hr at room temperature and the beads were removed of were washed to remove non-specific binding. Assay buffer containing DiFMUP and NiCl2 was added to the beads, mixed and incubated at room temperature for 30 min. Supernatant removed of beads was measured on a SpectraMax M3 plate reader. (A) Anti-PP2A dose-response. Three doses of anti-PP2A IgG were cross-linked to the beads and incubated with the same amount of input lysates (75 µg) for the phosphatase assay; (B) Flow through section after beads were removed was examined for the presence of PP2A to determine pulldown efficiency; (C) Input cell lysates dose-response. Same amount of anti-PP2A IgG (2.5 µg) was incubated with two doses of cell lysates (75 µg and 150 µg). PP2A activity was measured by DiFMU method. Y axis shows the absolute values of DiFMU in solutions; (D) LPS tolerance induced upregulated PP2A-activity in peritoneal macrophages. 75 µg of cell lysates harvested from naïve or tolerant peritoneal macrophages were subjected to immunoprecipitation with 2.5 µg of anti-PP2AC antibody. Y-axis shows the absolute values of DiFMU.
Figure 4
Figure 4
Increased TNF-α secretion from PP2ACα conditional knockout macrophages under both naïve and tolerant conditions. Elicited peritoneal macrophages were isolated from control PP2ACαl°x/l°x mice and PP2ACαl°x/l°x;LyZ-Cre mice. (A) Q-PCR analysis of PP2ACα mRNA expression. *** p < 0.001 as compared to control macrophages; (B) Western blotting for the catalytic subunit of PP2A (α and β isoforms) in control and PP2ACα knockout macrophages; (C) TNF-α secretion from naïve and tolerized cells. Both control and PP2ACα knockout cells were pre-treated with (tolerized) or without (naïve) 100 ng/mL LPS for 24 h and then re-stimulated with second LPS for 4 hrs. Supernatants were measured for TNF-α secretion by ELISA. * p< 0.05 as compared to naïve cells.
Figure 4
Figure 4
Increased TNF-α secretion from PP2ACα conditional knockout macrophages under both naïve and tolerant conditions. Elicited peritoneal macrophages were isolated from control PP2ACαl°x/l°x mice and PP2ACαl°x/l°x;LyZ-Cre mice. (A) Q-PCR analysis of PP2ACα mRNA expression. *** p < 0.001 as compared to control macrophages; (B) Western blotting for the catalytic subunit of PP2A (α and β isoforms) in control and PP2ACα knockout macrophages; (C) TNF-α secretion from naïve and tolerized cells. Both control and PP2ACα knockout cells were pre-treated with (tolerized) or without (naïve) 100 ng/mL LPS for 24 h and then re-stimulated with second LPS for 4 hrs. Supernatants were measured for TNF-α secretion by ELISA. * p< 0.05 as compared to naïve cells.
Figure 5
Figure 5
PP2A activity in control and pp2ACα knockout macrophages under both naïve and knockout conditions. Elicited peritoneal macrophages were pretreated with (tolerant) or without (naïve) 100 ng/mL LPS for 24 h. Total cell lysates were incubated with antibody cross-linked beads (control mouse IgG or anti-PP2A IgG) as described in Figure 3. Beads were incubated with phosphatase assay buffer containing DiFMUP and NiCl2 at 30 °C for 30 min. Supernatants were then removed and assayed for phosphatase activity. (A) Beads were boiled in 2 × SDS-PAGE loading buffer and protein bound to the beads was probed for PP2A; (B) PP2A activity. In control cells (PP2ACαl°x/l°x), tolerance induced an upregulation of phosphatase activity; whereas in PP2ACα knockout macrophages (PP2ACαl°x/l°x;lyM-Cre), PP2A activity was unchanged.
Figure 6
Figure 6
Effects of LPS tolerance and PP2ACα knockout on NFκB/IκB signaling. Elicited peritoneal macrophages were isolated from control PP2ACαl°x/l°x mice and PP2ACαl°x/l°x;lyM-Cre mice. Both cells were pre-treated with (tolerant) or without (naïve) 100 ng/mL LPS for 24 h. Cells were then washed and re-stimulated with second LPS for 0, 5, 15 and 45 min. Cell lysates were subjected to protein gel electrophoresis and western blot analysis with phospho-protein specific antibodies and endogenous control antibody.
Figure 7
Figure 7
Epigenetic regulation of TNF-α gene expression in tolerized control and PP2ACα knockout macrophages. Elicited peritoneal macrophages were isolated from control PP2ACαl°x/l°x mice and PP2ACαl°x/l°x;lyM-Cre mice. Both cells were pretreated with 100 ng/mL of LPS for 24 h and then washed and re-stimulated with second LPS (100 ng/mL) for 2 h. Chip-IP procedure was conducted as described in “Materials and Methods”. DNA samples subjected to immunoprecipitation were analyzed for the presence of TNF-α promoter sequences in the DNA/protein complex by Q-PCR and obtained CT values were standardized with the CT values from non-immuoprecipitated input DNA. Data was expressed as percentage of input DNA: % (ChIP/Total input). In these tolerized cells, PP2ACα knockout cells shows more binding of the epigenetic “on” signal (H3K4Me3) to the promoter region of TNF-α gene as compared to control cells (* p < 0.05).

Similar articles

Cited by

References

    1. Mumby M.C., Walter G. Protein phosphatases and DNA tumor viruses: Transformation through the back door? Cell. Regul. 1991;2:589–598. doi: 10.1091/mbc.2.8.589. - DOI - PMC - PubMed
    1. Shanley T.P., Vasi N., Denenberg A., Wong H.R. The serine/threonine phosphatase, PP2A: Endogenous regulator of inflammatory cell signaling. J. Immunol. 2001;166:966–972. doi: 10.4049/jimmunol.166.2.966. - DOI - PubMed
    1. Tian Q., Wang J. Role of serine/threonine protein phosphatase in Alzheimer’s disease. Neurosignals. 2002;11:262–269. doi: 10.1159/000067425. - DOI - PubMed
    1. Xin M., Deng X. Protein phosphatase 2A enhances the proapoptotic function of Bax through dephosphorylation. J. Biol. Chem. 2006;281:18859–18867. doi: 10.1074/jbc.M512543200. - DOI - PubMed
    1. Shi Y. Serine/threonine phosphatases: Mechanism through structure. Cell. 2009;139:468–484. doi: 10.1016/j.cell.2009.10.006. - DOI - PubMed

Publication types

MeSH terms

LinkOut - more resources