. 2015 Aug 18;43(14):7110-21.
doi: 10.1093/nar/gkv650. Epub 2015 Jun 29.

Characterization of ERM transactivation domain binding to the ACID/PTOV domain of the Mediator subunit MED25

Affiliations

Characterization of ERM transactivation domain binding to the ACID/PTOV domain of the Mediator subunit MED25

Isabelle Landrieu et al. Nucleic Acids Res. .

Abstract

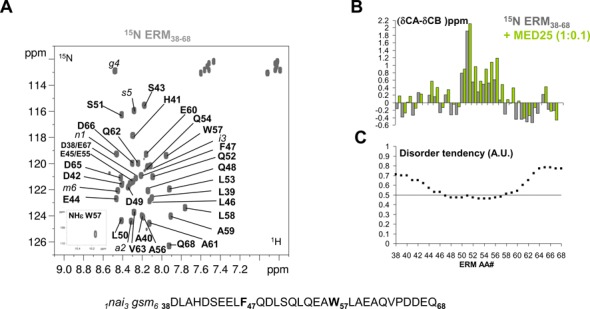
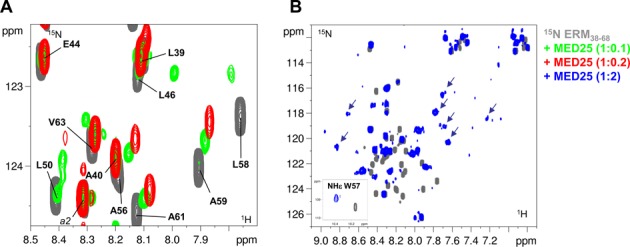
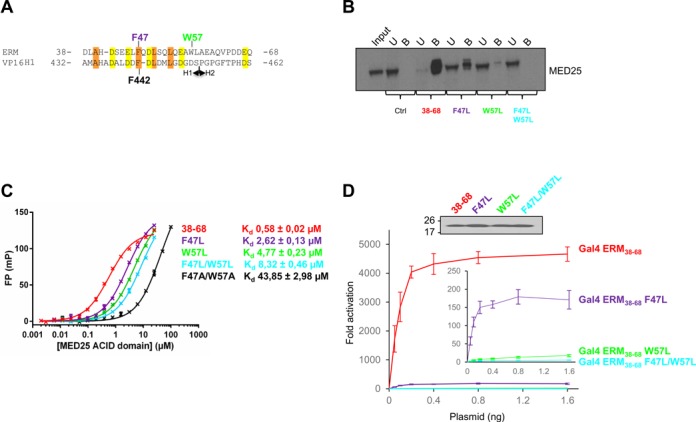
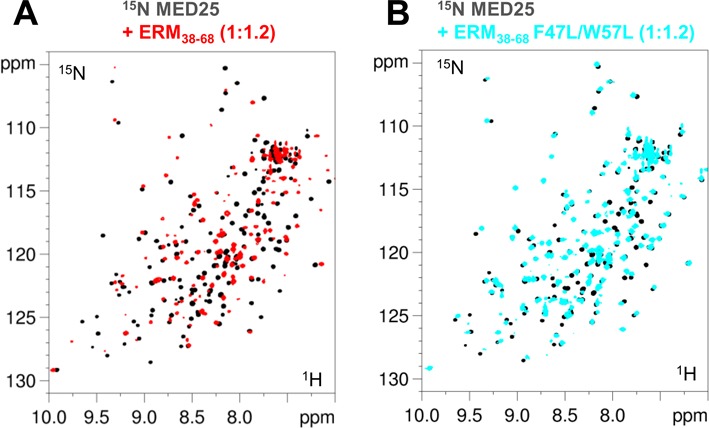
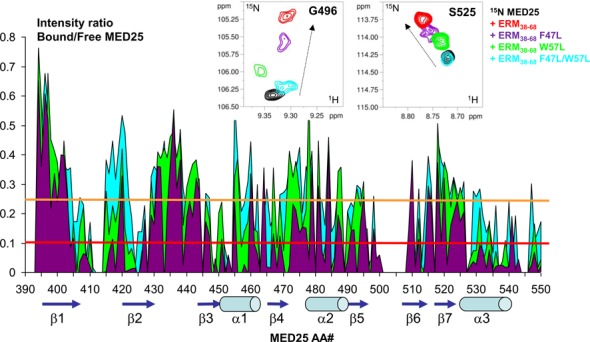
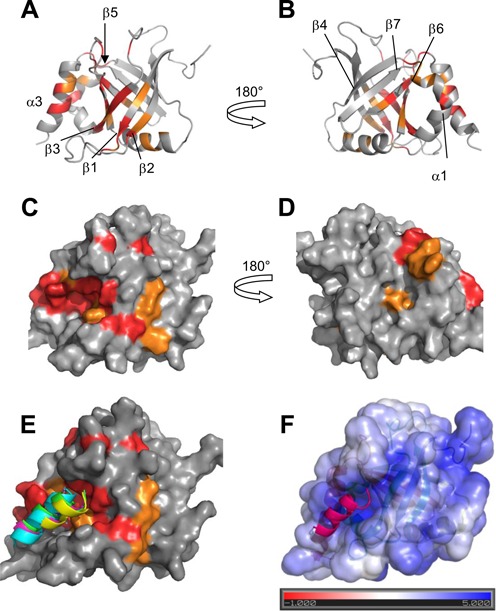
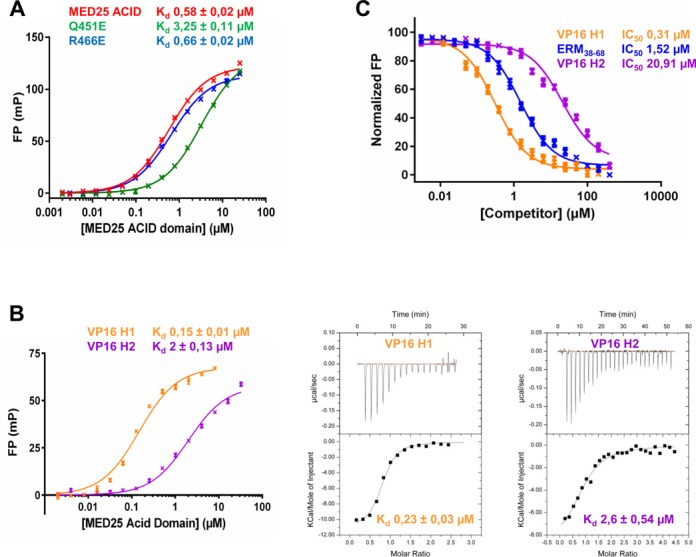
The N-terminal acidic transactivation domain (TAD) of ERM/ETV5 (ERM38-68), a PEA3 group member of Ets-related transcription factors, directly interacts with the ACID/PTOV domain of the Mediator complex subunit MED25. Molecular details of this interaction were investigated using nuclear magnetic resonance (NMR) spectroscopy. The TAD is disordered in solution but has a propensity to adopt local transient secondary structure. We show that it folds upon binding to MED25 and that the resulting ERM-MED25 complex displays characteristics of a fuzzy complex. Mutational analysis further reveals that two aromatic residues in the ERM TAD (F47 and W57) are involved in the binding to MED25 and participate in the ability of ERM TAD to activate transcription. Mutation of a key residue Q451 in the VP16 H1 binding pocket of MED25 affects the binding of ERM. Furthermore, competition experiments show that ERM and VP16 H1 share a common binding interface on MED25. NMR data confirms the occupancy of this binding pocket by ERM TAD. Based on these experimental data, a structural model of a functional interaction is proposed. This study provides mechanistic insights into the Mediator-transactivator interactions.


Figures

Figure 1.
Figure 1.
Conformation of ERM38–68. (A) Annotated 2D [1H, 15N] HSQC spectrum of ERM38–68. Sequence of ERM38–68 is shown below the spectrum, with aromatic residues F47 and W57 highlighted in bold. Residual amino acids after cleavage from the N-terminal fusion Halo-Tag are annotated in italic and numbered from 1 to 6. (B) Histogram of measured Cα−Cβ secondary chemical shifts along the ERM38–68 sequence (scale in ppm), grey bars are for the free ERM38–68, green bars for the MED25-bound ERM38–68 (stoichiometry 1 ERM/0.1 MED25). (C) Disorder prediction for each amino acid in the sequence (arbitrary units A.U.). The 0.5 lower threshold for disorder prediction is drawn as a line. metaPrDOS integrates the results of different prediction methods.
Figure 2.
Figure 2.
Interaction of ERM38–68 with MED25. (A) Superimposed enlarged view of 2D [1H, 15N] HSQC spectra of 15N-ERM38–68 (in grey), 15N-ERM38–68/unlabelled MED25 1/0.1 molar ratio (overlayed in green) and 15N-ERM38–68/unlabelled MED25 1/0.2 molar ratio (overlayed in red). (B) Superimposed 2D [1H, 15N] HSQC spectra of 15N-ERM38–68 (in grey) and 15N-ERM38–68/unlabelled MED25 1/2 molar ratio (overlayed in blue). Inlayed are HNϵ from the side chain of W57. The arrows indicate broadened resonances with chemical shift typical of a folded peptide.
Figure 3.
Figure 3.
Mutational analysis. (A) Sequence alignment of ERM38–68 with the Herpes simplex VP16 H1 subdomain. Conserved hydrophobic residues are boxed in orange, acidic residues in yellow. F47 (purple) and W57 (green) of ERM and F442 of VP16 H1 are indicated. (B) Endogenous MED25 binds specifically to ERM38–68. Nuclear extracts from DAMI cells were incubated with immobilized Halo-Tag, Halo-Tag ERM38–68, Halo-Tag ERM36–68 F47L, Halo-Tag ERM36–68 W57L and Halo-Tag ERM38–68 F47L/W57L. MED25 not associated with ERM wild-type and derivatives present in the supernatant was saved as the unbound fraction (U). Samples were separated by SDS-PAGE and MED25 was detected by western-blot. Input lane and unbound fraction represents 10% of total extract used in the pull-down, Bound fractions (B, 100%). (C) Fluorescence polarization (FP) peptide binding assay for ERM38–68, ERM38–68 F47L, ERM38–68 W57L, ERM38–68 F47L/W57L and ERM38–68 F47A/W57A. Measured Kd are indicated. TAMRA-labeled peptides were at 4 nM. (D) Effects of ERM TAD mutations on transcriptional activation. U2OS cells were transfected with increasing amounts of Gal4-ERM38–68 wild-type and derivatives together with a (Gal4)5-E1B-Luc reporter construct. In the inset, the data for ERM38–68 has been excluded and the scale expanded (Upper panel). The level of expression of the Gal4 derivatives was monitored by western-blot using an anti-Gal antibody.
Figure 4.
Figure 4.
Spectra of MED25. 2D [1H, 15N] HSQC spectra of 100μM 15N,13C-MED25 free in solution (black) or with 1.2 molar amount of (A) ERM38–68 (overlaid in red) and (B) F47L/W57L-ERM38–68 (overlaid in blue).
Figure 5.
Figure 5.
Mapping of the MED25 interaction site with ERM38–68 based on resonance line broadening in 2D spectra. (Upper panel) Details of overlaid 2D [1H, 15N] HSQC spectra of 125μM 15N-MED25 free in solution (black) or with 1.2 molar amount of ERM38–68 (red), F47L-ERM38–68 (purple), F47L/W57L-ERM38–68 (cyan) or 1.6 molar amount of W57L-ERM38–68 (green). (Lower panel) Graphic representation of relative intensity ratio I/I0 of corresponding resonances in [1H,15N] HSQC spectra of MED25 with 1.2 molar amount of F47L/W57L-ERM38–68 (cyan) and F47L-ERM38–68 (purple) or 1.6 molar amount of W57L-ERM38–68 (green), versus free in solution. Resonances between amino acid residues 501 and 508 are weak and were not included in the analysis, as well as the last 551–556 residues. The intensity profile for W57L-ERM38–68 interaction (green) was normalized on the terminal residue to correct for concentration of the sample. The orange threshold corresponds to the average I/I0 intensity ratio for the F47L/W57L-ERM38–68, the red one to the corresponding I/I0 average minus one I/I0 standard deviation. Peak picking was performed on [1H, 15N] HSQC spectra recorded as in Figure 4. Secondary structure elements are represented below the graphic as defined in the NMR structure of MED25 (PBD ID: 2L23, (16)). Numbering provided below the graphic corresponds to the ACID/PTOV domain in full length MED25.
Figure 6.
Figure 6.
MED25 interaction site with ERM38–68. (A) and (B) Ribbon representation of MED25 (PBD ID: 2L23, (16)) with labelling of secondary structures. (C) and (D) Molecular surface of MED25. (A) and (C) correspond to VP16 H1 binding site and (B) and (D) to VP16 H2 binding site, as defined in results. (B) and (D) representations were obtained by a 180° rotation around the vertical axis from (A) and (C), respectively. Colour coding is orange for residues with I/I0 below the average I/I0 and red, below the I/I0 average minus I/I0 standard deviation as defined from measurements shown in Figure 5 for interaction with F47L/W57L. Representations were created using Pymol. (E) Structural models of the ERM50–61 peptide bound to the ACID/PTOV domain. Surface view of the MED25 protein with CSD as in (C). Superimposed peptides are represented as ribbons and correspond to the four highest score models of cluster 2 that best fit the experimental data. (F) Structural model of one ERM50–61 peptide bound to the ACID/PTOV domain. The solvent-accessible surface of MED25 is coloured according to the electrostatic potential calculated using the APBS (Adaptative Poisson-Boltzman Solver) tools within Pymol (41) The colour scale ranges from red at −1 kT/e to blue at 5 kT/e. The dielectric constants were set at 2 for the protein and 80 for the solvent.
Figure 7.
Figure 7.
Competition between ERM38–68, VP16 H1 and VP16 H2 for binding to MED25 ACID/PTOV. (A) Comparison of the dissociation constant (Kd) values for the binding of MED25 ACID/PTOV domain and its mutants (Q541E and R466E) to ERM38–68. (B) (left) FP experiments and (right) ITC data of a titration of MED25 ACID/PTOV with VP16 H1 or VP16 H2 peptides to measure the binding affinity. (C) IC50 values for the displacement of TAMRA-ERM38–68 (4 nM) from MED25 ACID/PTOV (0.2 μM) by unlabelled ERM38–68 (LogEC50 = 0.18 ± 0.03), VP16 H1 (LogEC50 = −0.51 ± 0.04) and VP16 H2 (LogEC50 = 1.32 ± 0.04).

Similar articles

Cited by

References

    1. Green M.R. Eukaryotic transcription activation: right on target. Mol. Cell. 2005;18:399–402. - PubMed
    1. Borggrefe T., Yue X. Interactions between subunits of the Mediator complex with gene-specific transcription factors. Semin. Cell Dev. Biol. 2011;22:759–768. - PubMed
    1. Poss Z.C., Ebmeier C.C., Taatjes D.J. The Mediator complex and transcription regulation. Crit. Rev. Biochem. Mol. Biol. 2013;48:575–608. - PMC - PubMed
    1. Balamotis M.A., Pennella M.A., Stevens J.L., Wasylyk B., Belmont A.S., Berk A.J. Complexity in transcription control at the activation domain-mediator interface. Sci. Signal. 2009;2:ra20. - PMC - PubMed
    1. Malik S., Roeder R.G. The metazoan Mediator co-activator complex as an integrative hub for transcriptional regulation. Nat. Rev. Genet. 2010;11:761–772. - PMC - PubMed

Publication types

MeSH terms