

Generation and transcriptional programming of intestinal dendritic cells: essential role of retinoic acid
- PMID: 26129652
- PMCID: PMC4698111
- DOI: 10.1038/mi.2015.50
Generation and transcriptional programming of intestinal dendritic cells: essential role of retinoic acid
Abstract
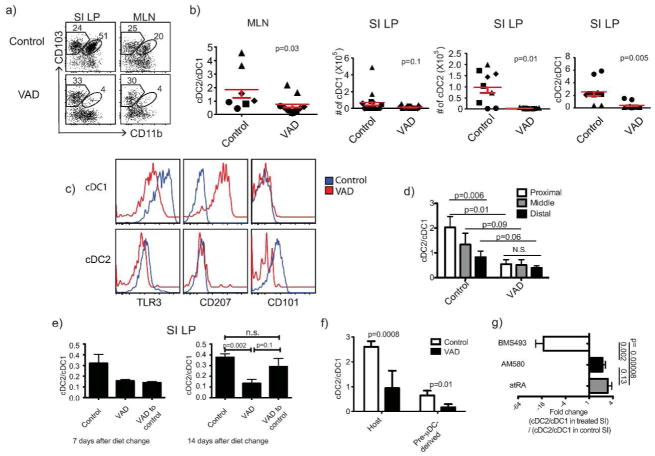
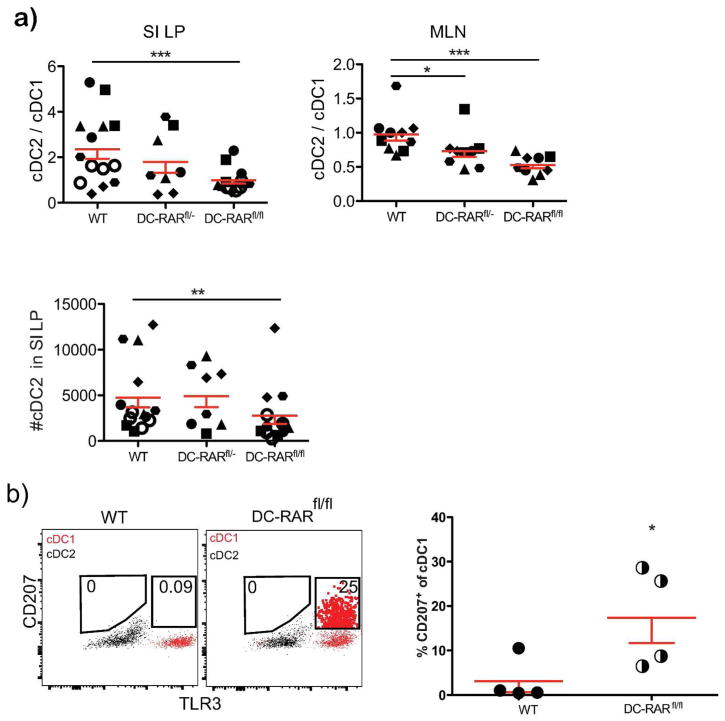
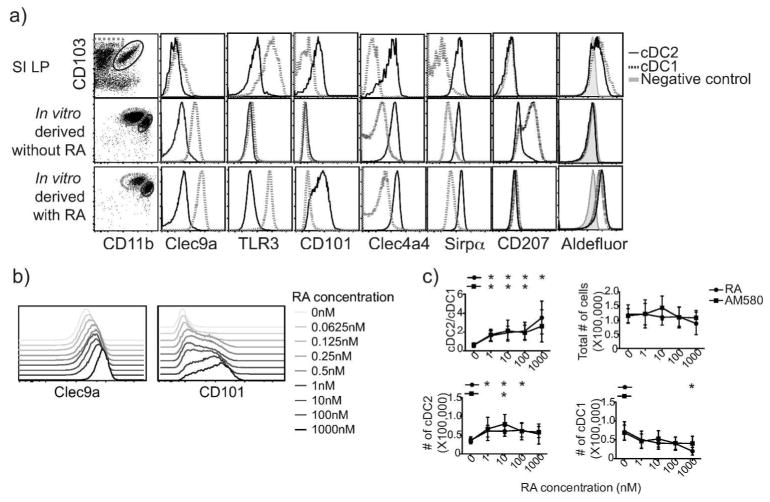
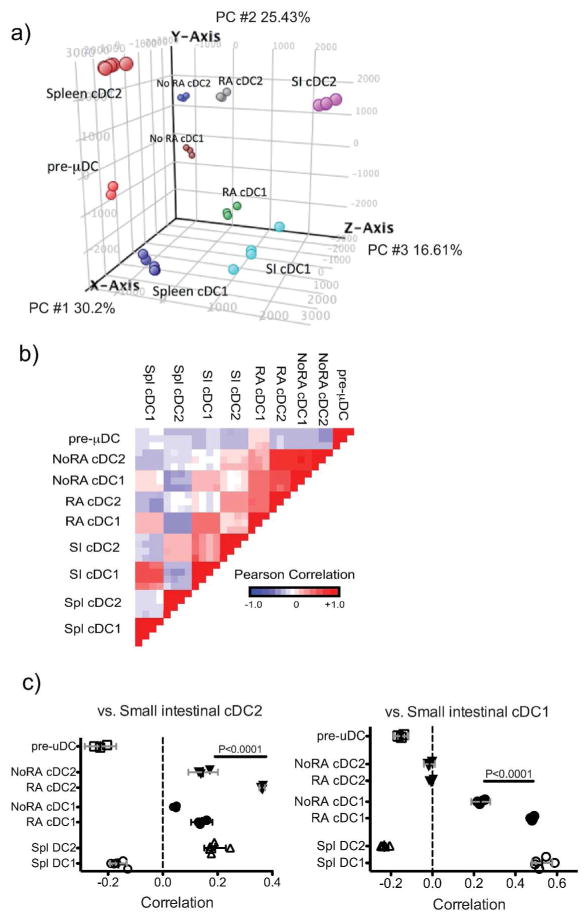
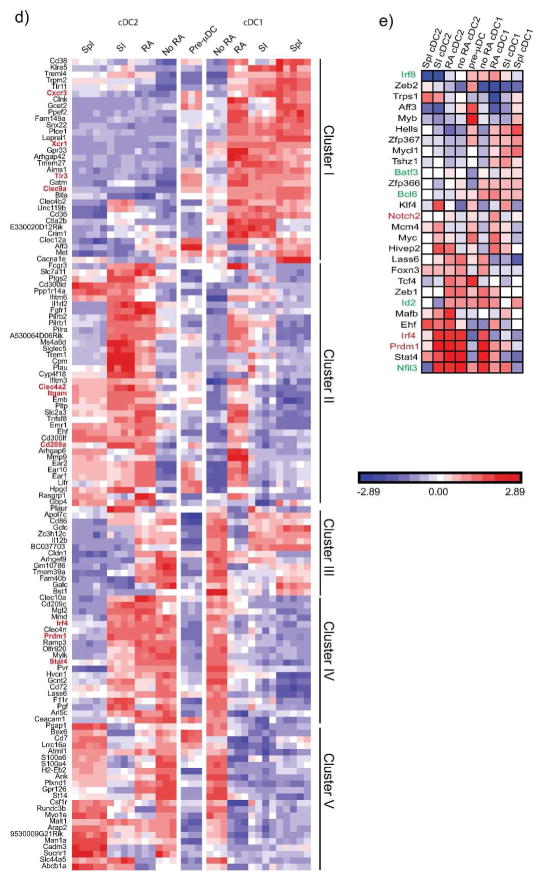
The vitamin A metabolite retinoic acid (RA) regulates adaptive immunity in the intestines, with well-characterized effects on IgA responses, Treg induction, and gut trafficking of T- and B-effector cells. It also controls the generation of conventional dendritic cell (cDC) precursors in the bone marrow and regulates cDC subset representation, but its roles in the specialization of intestinal cDC subsets are understudied. Here we show that RA acts cell intrinsically in developing gut-tropic pre-mucosal dendritic cell (pre-μDC) to effect the differentiation and drive the specialization of intestinal CD103(+)CD11b(-) (cDC1) and of CD103(+)CD11b(+) (cDC2). Systemic deficiency or DC-restricted antagonism of RA signaling resulted in altered phenotypes of intestinal cDC1 and cDC2, and reduced numbers of cDC2. Effects of dietary deficiency were most apparent in the proximal small intestine and were rapidly reversed by reintroducing vitamin A. In cultures of pre-μDC with Flt3L and granulocyte-macrophage colony-stimulating factor (GM-CSF), RA induced cDC with characteristic phenotypes of intestinal cDC1 and cDC2 by controlling subset-defining cell surface receptors, regulating subset-specific transcriptional programs, and suppressing proinflammatory nuclear factor-κB-dependent gene expression. Thus, RA is required for transcriptional programming and maturation of intestinal cDC, and with GM-CSF and Flt3L provides a minimal environment for in vitro generation of intestinal cDC1- and cDC2-like cDC from specialized precursors.
Conflict of interest statement
The authors disclose no conflicts.
Figures
Similar articles
-
Mesenteric lymph node CD11b- CD103+ PD-L1High dendritic cells highly induce regulatory T cells.Immunology. 2017 Sep;152(1):52-64. doi: 10.1111/imm.12747. Epub 2017 Jun 1. Immunology. 2017. PMID: 28423181 Free PMC article.
-
Butyrate and retinoic acid imprint mucosal-like dendritic cell development synergistically from bone marrow cells.Clin Exp Immunol. 2017 Sep;189(3):290-297. doi: 10.1111/cei.12990. Epub 2017 Jun 13. Clin Exp Immunol. 2017. PMID: 28542882 Free PMC article.
-
Selective and efficient generation of functional Batf3-dependent CD103+ dendritic cells from mouse bone marrow.Blood. 2014 Nov 13;124(20):3081-91. doi: 10.1182/blood-2013-12-545772. Epub 2014 Aug 6. Blood. 2014. PMID: 25100743 Free PMC article.
-
Vitamin A and immune regulation: role of retinoic acid in gut-associated dendritic cell education, immune protection and tolerance.Mol Aspects Med. 2012 Feb;33(1):63-76. doi: 10.1016/j.mam.2011.11.001. Epub 2011 Nov 22. Mol Aspects Med. 2012. PMID: 22120429 Free PMC article. Review.
-
Intestinal CD103+ dendritic cells: master regulators of tolerance?Trends Immunol. 2011 Sep;32(9):412-9. doi: 10.1016/j.it.2011.06.003. Epub 2011 Aug 2. Trends Immunol. 2011. PMID: 21816673 Review.
Cited by
-
Dynamic Changes in the Phenotype of Dendritic Cells in the Uterus and Uterine Draining Lymph Nodes After Coitus.Front Immunol. 2020 Sep 11;11:557720. doi: 10.3389/fimmu.2020.557720. eCollection 2020. Front Immunol. 2020. PMID: 33013926 Free PMC article.
-
Distinct ontogenetic lineages dictate cDC2 heterogeneity.Nat Immunol. 2024 Mar;25(3):448-461. doi: 10.1038/s41590-024-01745-9. Epub 2024 Feb 13. Nat Immunol. 2024. PMID: 38351322 Free PMC article.
-
Topical Application of a Vitamin A Derivative and Its Combination With Non-ablative Fractional Laser Potentiates Cutaneous Influenza Vaccination.Front Microbiol. 2018 Oct 30;9:2570. doi: 10.3389/fmicb.2018.02570. eCollection 2018. Front Microbiol. 2018. PMID: 30425691 Free PMC article.
-
Mucosal Mesenchymal Cells: Secondary Barrier and Peripheral Educator for the Gut Immune System.Front Immunol. 2017 Dec 13;8:1787. doi: 10.3389/fimmu.2017.01787. eCollection 2017. Front Immunol. 2017. PMID: 29321781 Free PMC article. Review.
-
A novel in vitro model of the small intestinal epithelium in co-culture with 'gut-like' dendritic cells.Discov Immunol. 2023 Oct 7;2(1):kyad018. doi: 10.1093/discim/kyad018. eCollection 2023. Discov Immunol. 2023. PMID: 38567056 Free PMC article.
References
-
- Crozat K, Tamoutounour S, Vu Manh TP, et al. Cutting edge: expression of XCR1 defines mouse lymphoid-tissue resident and migratory dendritic cells of the CD8alpha+ type. J Immunol. 2011 Nov 1;187(9):4411–4415. - PubMed
-
- Zhang JG, Czabotar PE, Policheni AN, et al. The dendritic cell receptor Clec9A binds damaged cells via exposed actin filaments. Immunity. 2012 Apr 20;36(4):646–657. - PubMed
Publication types
MeSH terms
Substances
Grants and funding
LinkOut - more resources
Full Text Sources
Other Literature Sources
Molecular Biology Databases
Research Materials
Miscellaneous
